9007116752
c3creativedomain@gmail.com

C-Cube
Centre of Computer Education
- Courses
- Best Data Science Training Institute
- Data Science with R
- Financial Data Analytics
- Data Analytics Courses in Kolkata (Offline + Placement Support 2026)
- Full Stack Development Course Kolkata
- Website Development
- Android App Development
- Programming Training Institute
- Institute For Cyber Security kolkata
- Data Structure & Algorithm
- Digital Marketing Course
- Best Spoken English Institute in Kolkata | C-Cube
- Marketing Analytics Training in Kolkata
- Share Trading Institute
- F.A & Ms-Office
- About Us
- Contact Us
- Blog
- Gallery
Practical Data Analytics Courses in Kolkata for Career Growth- Complete Guide
As educators associated with computer training and student skill development for more than 25 years, we have seen a growing demand for Practical Data Analytics skills across industries. Today, students and working professionals are looking for career-focused learning that helps them build analytical thinking, business understanding, and real-world problem-solving abilities.
In today’s data-driven environment, companies rely heavily on data for reporting, decision-making, and business growth. This has created strong demand for skilled professionals who can work confidently with tools like Advanced Excel, SQL, Python, and Power BI.
A practical Data Analytics learning approach helps learners develop industry-relevant skills through hands-on projects, dashboards, reports, and real datasets. Whether you are a beginner, graduate, or working professional planning a career transition, structured analytics training can open up valuable long-term career opportunities.
Quick Contact Form
Why Students Are Choosing Practical Data Analytics Training in Kolkata ?
From our experience of working with students and young professionals over the years, we have noticed that learners today are becoming more career-aware and skill-focused while choosing professional courses.
Some of the major reasons why students are increasingly choosing Data Analytics learning include:
- Growing demand for data-driven decision-making across industries
- Strong career opportunities in IT, business, finance, marketing, healthcare, and retail sectors
- Increasing importance of analytical and problem-solving skills in modern workplaces
- Better understanding of business reporting, dashboards, and data visualization
- Career transition opportunities for graduates and working professionals
Today, students are not only looking for certificates but also for practical exposure that helps them understand how analytics is actually used in real business environments.
What Is Data Analytics and Why Is It Important Today?
Data Analytics is the process of collecting, organizing, analyzing, and interpreting data to understand patterns, solve problems, and support better business decisions. In simple words, it helps organizations convert raw data into meaningful insights that can improve performance and planning.
Over the years, we have observed that businesses across almost every industry now rely heavily on data for everyday decision-making. Whether it is sales analysis, customer behavior, marketing performance, financial reporting, or business growth planning, data plays an important role everywhere.
This is one of the major reasons why Data Analytics has become a valuable career skill today.
- Companies depend on data to make smarter business decisions
- Organizations use analytics to understand customer needs and market trends
- Businesses increasingly rely on dashboards, reports, and visual insights
- Skilled analytics professionals are needed across multiple industries
- Practical analytical skills are now considered valuable in modern workplaces
From our experience, students who develop practical analytical thinking along with hands-on tool knowledge are often better prepared for evolving industry requirements and long-term career growth.
Why Practical Learning Matters in Data Analytics ?
From our experience, students often understand Data Analytics concepts more effectively when they work with practical examples instead of depending only on theoretical learning. Hands-on practice helps learners understand how data is actually used for reporting, visualization, analysis, and decision-making in real business environments.
Practical learning also improves confidence, analytical thinking, and problem-solving ability, which are important for long-term career growth in this field.
Some important advantages of practical analytics learning include:
- Better understanding of real datasets and reporting processes
- Improved confidence in creating dashboards and analytical reports
- Stronger problem-solving and logical thinking skills
- Better preparation for industry-oriented projects and interviews
- Clear understanding of how analytics tools are used in real workplaces
Students who want to explore how practical learning supports career opportunities in analytics can also read our detailed guides on:
- How Practical Data Analytics Training Helps Build Career Opportunities in Kolkata
- Why Students in Kolkata Are Choosing Data Analytics as a Career in 2026
What You Will Learn in Our Data Analytics Training ?
- Complimentary Python Programming Bootcamp
- Designed for Working Professionals and Students
- 20+ Case Studies and 3+ Industry Projects
- Dedicated Student Support
- Exclusive Job Assistance
- Live coding classes and profile building workshops
- Programming – Python , SQL
- Statistics – Basic Statistics
- Data Manipulation & Analysis – Data Cleaning , Data Wrangling , Data Visualization , Explanatory Data Analysis(EDA)
- Advance Excel – Data Analysis with Excel Tools & Functions
- Tableau – Critical Analysis for Data visualization through Tableau.
- Opportunity to wok on live-projects as part of Internship on reputed Companies.
- Internship work certificate
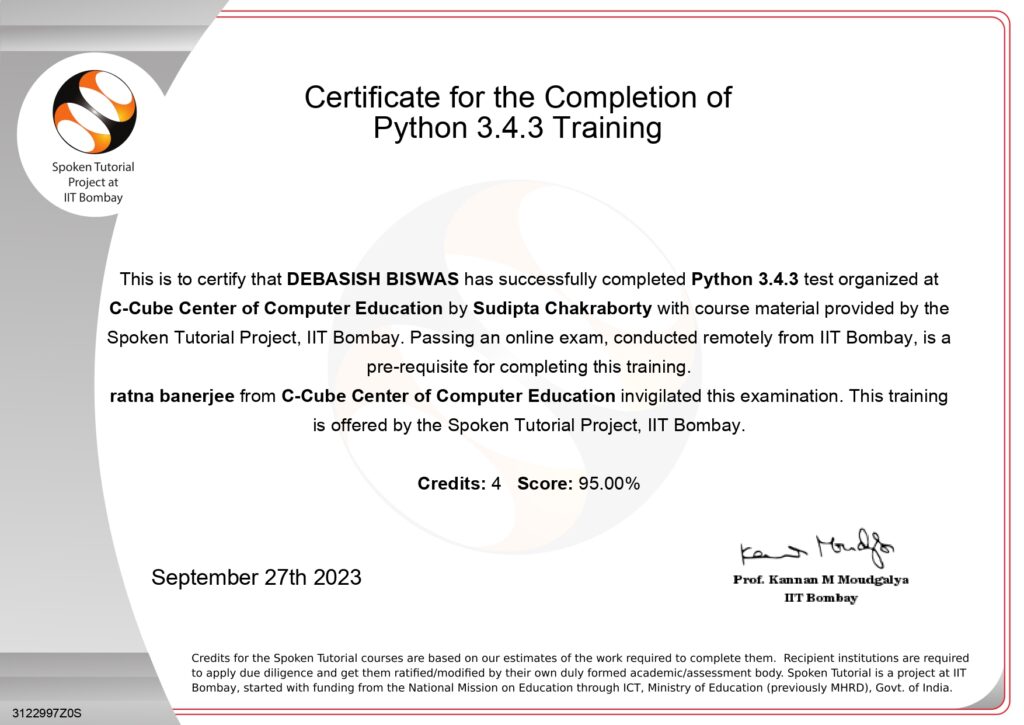
- Certification on Python from IIT Bombay
- Certification on Excel from Microsoft Global.
- Certification on Diploma in Data Analytics from Central Govt.of India (NBCE)
Both the below mode of Training is available.
Online Mode – Live Class
Offline Mode
Course Curriculum For Data Analytics Training
Module 1 - Python
Introduction to Python , Variables , Data Types , Numbers, Casting , Python String ,Booleans , Operators , Loops In Python , Functions in Python
Python List , Tuples , Sets , Dictionary , Data Frame , Lambda Function , Arrays in Python , Python Class & Objects , Python Inheritance , File Handling with Python , Use of Numpy, Use of Pandas for Data Analysis.
Matplotlib Python Intro , Pyplot, Plotting , Markers, Line , Labels , Grid , Subplots , Scatter Bars , Histogram , Pie Charts
Module 2 - SQL
Concepts of RDBMS , Datatypes , Operators , Create Database , Select Database , Show Database , Drop Database , Create Tables , Show Tables , Rename Tables , Alter Tables , Drop Tables , Delete Tables , Truncate Tables
SQL queries on Insert , Select , Update , Delete , Sorting Results , SQL Views on Create , Update , Rename , Drop , SQL Operators – Where Clause , Distinct Clause , Order By Clause , Group By Clause , Having Clause , AND , OR
Inner Join , Left Join , Right Join , Full Join , Union VS Join , Cross Join
One-to-One Relationship , One-to-Many Relationship , Many-to-Many Relationship , Many-to-One Relationship
Primary Key , Foreign Key , Alternate Key , Composite Key , Unique Key
Date , String , Aggregate , Numeric , Statistical , Logical
Module -3 - Excel
- Getting Started with Excel
- Excel Interface Overview: Ribbon, toolbar, workbook, worksheet basics
- Creating and Saving Workbooks: Starting a new workbook, saving options
- Basic Navigation: Moving between cells, worksheets, and using shortcuts
- Entering Data: Typing and editing text, numbers, dates, and special characters
- Basic Formatting: Changing font, color, cell alignment, and styles
- Basic Formulas and Functions
- Basic Arithmetic Operations: Addition (+), subtraction (-), multiplication (*), division (/)
- AutoSum Function: SUM for adding values quickly
- Basic Functions: MIN, MAX, AVERAGE, COUNT, COUNTA
- Relative vs. Absolute References: Using $ for fixed cell references
- Basic Date Functions: TODAY, NOW, YEAR, MONTH, DAY
- Data Entry and Editing
- Copy, Cut, and Paste: Moving and duplicating data
- AutoFill and Flash Fill: Filling series, dates, and patterns automatically
- Undo and Redo: Correcting mistakes quickly
- Find and Replace: Searching for data and replacing it
- Basic Formatting Techniques
- Cell Formatting: Number, date, currency, and percentage formats
- Conditional Formatting: Highlighting cells based on criteria
- Borders and Shading: Enhancing cell visibility and organization
- Adjusting Row Height and Column Width: Customizing sheet layout
- Basic Charts and Visualization
- Introduction to Charts: Types of charts (column, bar, line, pie)
- Creating Simple Charts: Selecting data and inserting charts
- Formatting Charts: Titles, legends, labels, colors
- Basic Data Visualization Tools: Sparklines, data bars, color scales
- Data Sorting and Filtering
- Sorting Data: Sorting alphabetically, by number, or date
- Filtering Data: Using filters to view specific data
- Custom Sorting and Filtering Options: Sorting by multiple columns, filtering by conditions
- Basic Data Validation and Protection
- Data Validation Basics: Creating dropdown lists, restricting data entry
- Error Alerts: Customizing error messages for invalid data
- Basic Protection: Locking cells and protecting sheets to prevent editing
- Introduction to Pivot Tables
- Creating a Simple Pivot Table: Organizing and summarizing data
- Pivot Table Fields: Row, column, value, and filter fields
- Basic Pivot Table Customization: Sorting, filtering, and formatting in Pivot Tables
- Basic Printing and Page Layout
- Print Setup: Page orientation, scaling, and print area selection
- Headers and Footers: Adding titles, page numbers, and dates
- Print Preview: Reviewing layout before printing
- Page Layout Adjustments: Margins, fit to page, repeating headers
- Basic Excel Tips and Tricks
- Keyboard Shortcuts: Common shortcuts for efficiency (e.g., Ctrl + Z, Ctrl + C, Ctrl + V)
- Freeze Panes and Split Window: Keeping headers visible while scrolling
- Basic Troubleshooting: Common error messages and how to resolve them
- Introduction to Templates: Using built-in templates for specific tasks
Advanced Formulas & Functions
- Lookup and Reference Functions: VLOOKUP, HLOOKUP, INDEX, MATCH, INDIRECT
- Logical Functions: IF, AND, OR, IFERROR, IFS, SWITCH
- Text Functions: CONCATENATE, TEXTJOIN, LEFT, RIGHT, MID, FIND, SUBSTITUTE
- Math & Statistical Functions: SUMIF, SUMIFS, COUNTIF, COUNTIFS, AVERAGEIF, AVERAGEIFS
- Date & Time Functions: DATE, TODAY, NETWORKDAYS, EOMONTH, YEAR, MONTH, DAY, DATEDIF, TIME
- Dynamic Array Functions: FILTER, SORT, UNIQUE, SEQUENCE, SORTBY
- Financial Functions: NPV, IRR, PMT, FV, PV
- Data Analysis Tools
- Pivot Tables: Creating, modifying, grouping, and summarizing data
- Pivot Charts: Visualizing Pivot Table data, customizing, using slicers
- Data Tables: One-variable and two-variable data tables
- Goal Seek and Solver: Optimization and “what-if” analysis
- Scenario Manager: Creating, editing, and analyzing scenarios
- Data Validation: Dropdown lists, input restrictions, error messages
- Data Visualization
- Charts and Graphs: Line, bar, pie, area, scatter, combo charts, waterfall, funnel
- Conditional Formatting: Rules, icons, color scales, and data bars
- Sparklines: Inserting and customizing mini charts within cells
- Advanced Charting Techniques: Dynamic charts, combo charts, custom charts
- Interactive Dashboards: Using slicers, form controls, and hyperlinks for interactivity
- Data Cleaning and Transformation
- Text to Columns: Splitting data into separate columns
- Remove Duplicates: Identifying and removing duplicate entries
- Flash Fill: Automatic pattern recognition for data entry
- Power Query: Importing, cleaning, and transforming data from different sources
- Error Handling: IFERROR, ISERROR, ISNUMBER, and troubleshooting techniques
- Power Pivot and DAX (Data Analysis Expressions)
- Power Pivot Basics: Adding data models, relationships, creating measures
Module 4- Tableau
- Overview of Tableau and its capabilities
- Installation and setup
- Tableau interface overview (shelves, data pane, toolbar)
- Data sources and connections (Excel, SQL, CSV, etc.)
- Live vs. Extract connections
- Data joins and blending
- Managing and editing data connections
- Data types and data roles
- Renaming, grouping, and splitting fields
- Pivoting data and performing calculations
- Using data interpreter and data preparation tools
- Creating basic charts (bar, line, pie, scatter)
- Working with marks, filters, and dimensions
- Using shelves (rows, columns, color, size, label)
- Sorting, grouping, and drilling down data
- Creating calculated fields
- Basic arithmetic, logical, and string functions
- Using level of detail (LOD) calculations
- Understanding table calculations and quick table calculations
- Adding titles, captions, and tooltips
- Working with colors, fonts, and formatting
- Customizing axes and labels
- Using shapes and icons in visualizations
- Building dashboards and stories
- Adding interactivity with actions (filter, highlight, URL)
- Customizing dashboard layout and design
- Using device layouts for mobile and desktop
- Adding trend lines, forecasts, and reference lines
- Clustering and outlier detection
- Using parameters for dynamic analysis
- Analyzing data with Tableau Prep
Eligibility Criteria For Data Analytics Training
-
-
Beginners
-
Commerce students
-
Recent Graduates
-
Working professionals
-
non-IT learners
-
Best Suited For
IT Professionals
Marketing Professionals
Recent Graduates
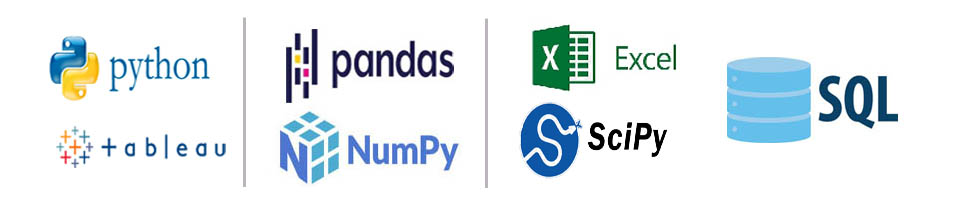
Skills & Technology Covered in Data Analytics Training Course
Our Certifications for Data Analysis Training
IIT Bombay Certification for Python
Central Govt. Certification for
Diploma in Data Analytics
National Board of Computer Education is a multi-award winning educational content portal. All the courses are launched after an initial survey. The courses fulfill the requirement of the students. To gain professional qualification, certification and extra classes in career orientation and self-development. After completion of each module the performance of the students is monitored through regular tests to develop their skills. That the students should appear successfully. In the Job market and handle the situation confidently.Our students are employed in reputed organization both in India and Abroad. The key to success in ensuring quality training by the experts. Provide education for the rural youth enabling him to play a part of the global development.

Data Analyst Course vs Data Analytics Course
Many people search for both data analyst course in kolkata and data analytics training, often assuming they are different.
In reality:
- A data analytics course teaches tools and techniques
- A data analyst role focuses on applying those skills
Our course is designed to prepare you for both learning and career application.
Career Opportunities After Data Analytics Training
From our experience, one of the biggest reasons students and working professionals are increasingly exploring Data Analytics is the wide range of career opportunities available across industries today. A practical understanding of analytical tools and business reporting can open opportunities in sectors such as IT, finance, marketing, healthcare, e-commerce, education, retail, and business operations.
Some common career roles after learning Data Analytics include:
Data Analyst
Business Analyst
MIS Executive
Reporting Analyst
From what we have observed over the years, learners who focus on practical understanding, continuous practice, and analytical thinking gradually develop stronger confidence and better long-term career growth opportunities in the field of Data Analytics.
Data Analytics Courses Kolkata – Fees, Duration & Certification
The duration of the course typically ranges between 3 to 6 months, depending on the learning pace and batch type.
At C-Cube:
- Fees are affordable and student-friendly
- Flexible payment options are available
- Certification is provided after course completion
This certification helps demonstrate your skills to employers.
Why Choose C-Cube for Data Analytics Training in Kolkata?
With over 25 years of experience in computer education, C-Cube has built a strong reputation for quality training.
Key advantages include:
- Experienced trainers
- Industry-oriented curriculum
- Practical training approach
- Placement assistance
- Supportive learning environment
Our goal is not just to teach but to help students build confidence and real-world skills.
Classroom vs Online Data Analytics Courses
While online learning is popular, classroom training still provides unique benefits.
Offline training helps in:
- Better focus and discipline
- Interactive learning experience
- Faster problem-solving
That is why many students prefer data analytics offline course in kolkata for effective learning.
Explore More Career Guidance on Data Analytics
Choosing the right learning path in Data Analytics often becomes easier when students understand how the industry works, what skills companies expect, and how practical learning supports long-term career growth. Over the years, we have tried to guide students not only through technical training but also through practical career awareness and industry understanding.
To help learners explore the field more clearly, we have also shared detailed career guidance articles on important Data Analytics topics:
These articles discuss practical learning, career opportunities, industry trends, and important factors students should understand before choosing a professional learning path in Data Analytics and related technology fields.
Data Analytics FAQs
As such, there is no prerequisite for undertaking this training. However, it is highly desirable if you possess the following skills sets
- Analytical expertise
- Good critical thinking and problem-solving skills
- Communication Skills
- Data Analyst has become the spine around which crucial company decisions are made. Organisations are paying top dollars to recruit Data Analyst professionals and the demand is only going to increase with the influx of data from new sources. The career roles that you can cherry pick are
- Data Analyst
- Research Analyst
- PMO
- Business Analyst Consultant / Manager
- Data Analyst In Various Domains/ Functions eg: Banking, Health Care, Retail, Telecom, e-Commerce, Marketing, Sales, HR & Finance.
- The companies in the above domains are generating huge amounts of data which requires a specialist to analyse and generate insights from this data & that requires some amount of functional knowledge from the above departments. For eg: Data from Sales Dept can be analysed efficiently by a data analyst who has sound knowledge on sales.
A Data Analytics course equips individuals with the skills to analyze and interpret complex data, enabling informed decision-making and problem-solving across various industries. It provides expertise in tools like Excel, Python, R, and SQL, along with knowledge of data visualization, predictive modeling, and statistical analysis. These skills are in high demand, offering lucrative career opportunities in fields like finance, healthcare, marketing, and technology. Additionally, the course fosters critical thinking, enhances strategic planning abilities, and helps organizations leverage data for competitive advantage.
The scope of a Data Analytics course is vast, as data is crucial for decision-making in almost every industry. Businesses use data analytics to improve efficiency, understand customer behavior, and predict future trends. From healthcare and finance to marketing and technology, companies rely on skilled data analysts to make sense of their data. With the growing importance of data-driven strategies, there is a high demand for professionals with analytics skills, offering excellent career prospects and opportunities to work in diverse fields.
- Due to the huge void in the demand-supply of Data Analysts in the market, companies are looking for all sorts of experience who have Data Analyst Skills including freshers too. There are huge number of job openings that are awaiting freshers in the Data Analyst Field
- Data Analyst helps a Data Scientist in the execution of Data Science Projects by extracting data from SQL and cleaning the data using various tools, before it can be passed onto a Data Scientist. When the data analyst gets promoted they become Data Scientists.
So, Data Scientists would build the machine learning algorithms using Python. Ultimately, the data that has been received from Data Analysts.
Data Analyst and Data Scientist jobs are of the stream, but the level of difficulty and skillset would vary as stated above. But both the roles have a great upskilling value in today’s job market.
Which is the best data analytics course in Kolkata?
C-Cube Centre of Computer Education kolkata , offers a practical and industry-focused training program suitable for beginners and professionals.
Why Does Practical Learning Matter in Data Analytics?
Practical learning helps students understand how analytics concepts are applied in real business situations instead of only learning theory. Working with real datasets, dashboards, reports, and case studies improves analytical thinking, problem-solving ability, and confidence in using tools like Excel, SQL, Python, and Power BI.
Students who want to understand how practical analytics learning supports long-term career growth can also explore our detailed guide on Data Analytics learning and industry applications.
Do you provide offline classes?
Yes, we offer classroom-based training in Kolkata.
What is the duration of the course?
The course duration is usually between 8 to 9 months with projects.
Is placement assistance provided?
Yes, we guide students with interview preparation and career support.
Can beginners join this course?
Yes, the course is designed for beginners with no prior technical knowledge.