
9007116752
c3creativedomain@gmail.com
C-Cube
Centre of Computer Education
- Courses
- Best Data Science Training Institute
- Data Science with R
- Financial Data Analytics
- Data Analytics Courses in Kolkata (Offline + Placement Support 2026)
- Full Stack Development Course Kolkata
- Website Development
- Android App Development
- Programming Training Institute
- Institute For Cyber Security kolkata
- Data Structure & Algorithm
- Digital Marketing Course
- Best Spoken English Institute in Kolkata | C-Cube
- Marketing Analytics Training in Kolkata
- Share Trading Institute
- F.A & Ms-Office
- About Us
- Contact Us
- Blog
- Gallery
Advanced Excel Training in Kolkata
Build advanced spreadsheet and data analysis skills with practical Advanced Excel Training in Kolkata designed for students, job seekers, and working professionals.
- Master Advanced Excel Skills for data analysis, reporting, and business decision-making.
- Learn Excel Automation and Data Analysis using Pivot Tables, Power Query, advanced formulas, and practical techniques.
- Build confidence to handle Complex Excel Tasks and create professional reports using real-world business datasets.
- Develop Job-Oriented Excel Skills that can support careers in MIS, data analytics, finance, operations, and business reporting.
Quick Contact Form
Our Training Partners
IIT Bombay ST Program

Microsoft Global Certification


Nasscom Future Skill Prime

National Board of Computer Education
Course Overview
Our Advanced Excel Course in Kolkata is designed to help learners move beyond basic spreadsheet use and understand how Excel is applied in reporting, data analysis, automation, and everyday business tasks. From our experience of teaching students and working professionals, we have seen that knowing individual formulas is not enough. A learner must also understand how to organise data, choose the right Excel tool, and solve practical problems efficiently.
The Advanced Excel Training Course therefore follows a progressive learning approach—from working with structured datasets and advanced formulas to Pivot Tables, Power Query, dashboards, and automation. The focus is on developing Practical Excel Knowledge that learners can apply while working with real business data
Build Strong Data Management Skills
Professional Excel work often begins with properly organised data. Learners develop Excel Data Management Skills by working with tables, data validation, named ranges, sorting, filtering, duplicate records, and structured datasets. These techniques help create cleaner and more reliable spreadsheets for further analysis.
Work Confidently with Advanced Formulas
Instead of memorising formulas separately, students learn how to combine Advanced Excel Formulas and Functions to solve practical problems. XLOOKUP, INDEX and MATCH, SUMIFS, COUNTIFS, IF, IFS, text functions, date functions, and error-handling techniques are practised through reporting and data-based exercises.
Analyse Data with Pivot Tables and Charts
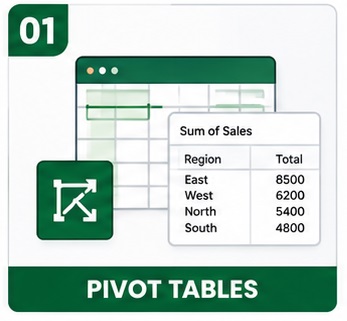
Excel Data Analysis with Pivot Tables helps learners summarise large datasets, compare performance, identify patterns, and prepare meaningful reports. Pivot Charts, slicers, timelines, and visual reporting techniques are also introduced to help students communicate data more clearly.
Clean and Transform Data with Power Query
Modern Excel users often spend significant time preparing messy or inconsistent data. Through Power Query in Excel, learners understand how to import, clean, merge, append, and transform datasets from different sources. The objective is to reduce repetitive manual work and build a more organised data preparation process.
Create Dashboards and Business Reports
Learners develop Excel Dashboard and Reporting Skills by combining charts, Pivot Tables, KPIs, slicers, and structured layouts. The emphasis is not simply on making dashboards attractive, but on presenting useful information that managers and business teams can understand quickly.
Learn Through Practical Business Exercises
Our approach to Hands-On Advanced Excel Training is based on learning through practice. Learners work with sales reports, employee data, MIS records, inventory information, and other business-oriented datasets to understand how different Excel tools work together.
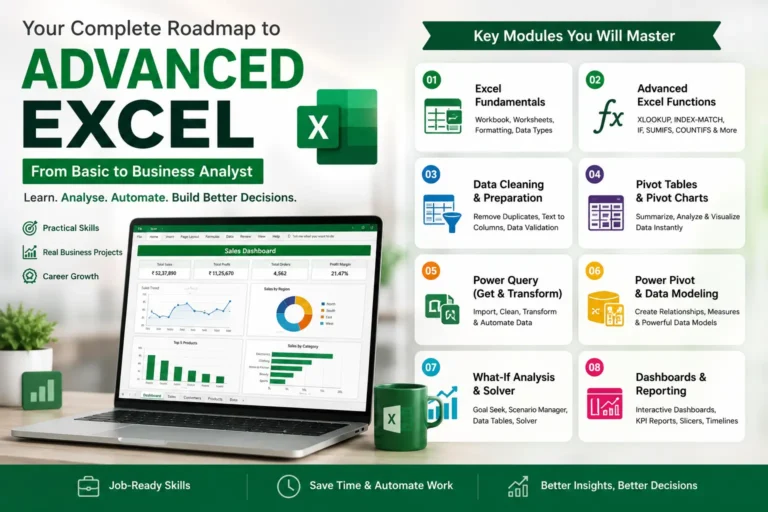
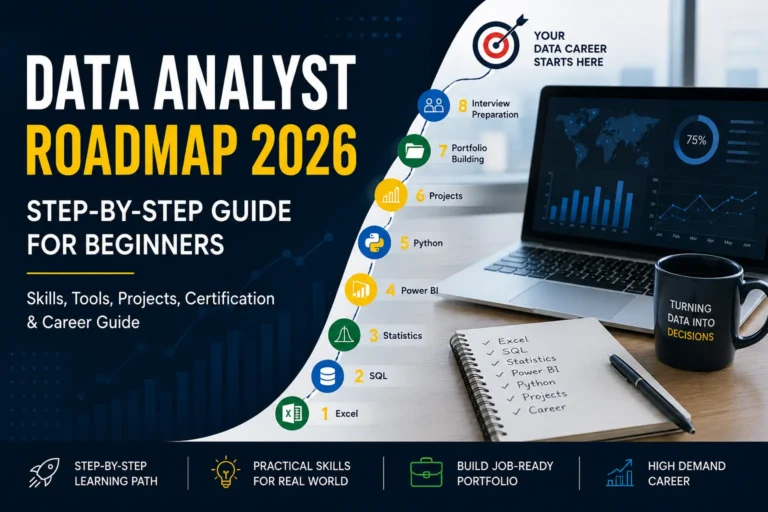
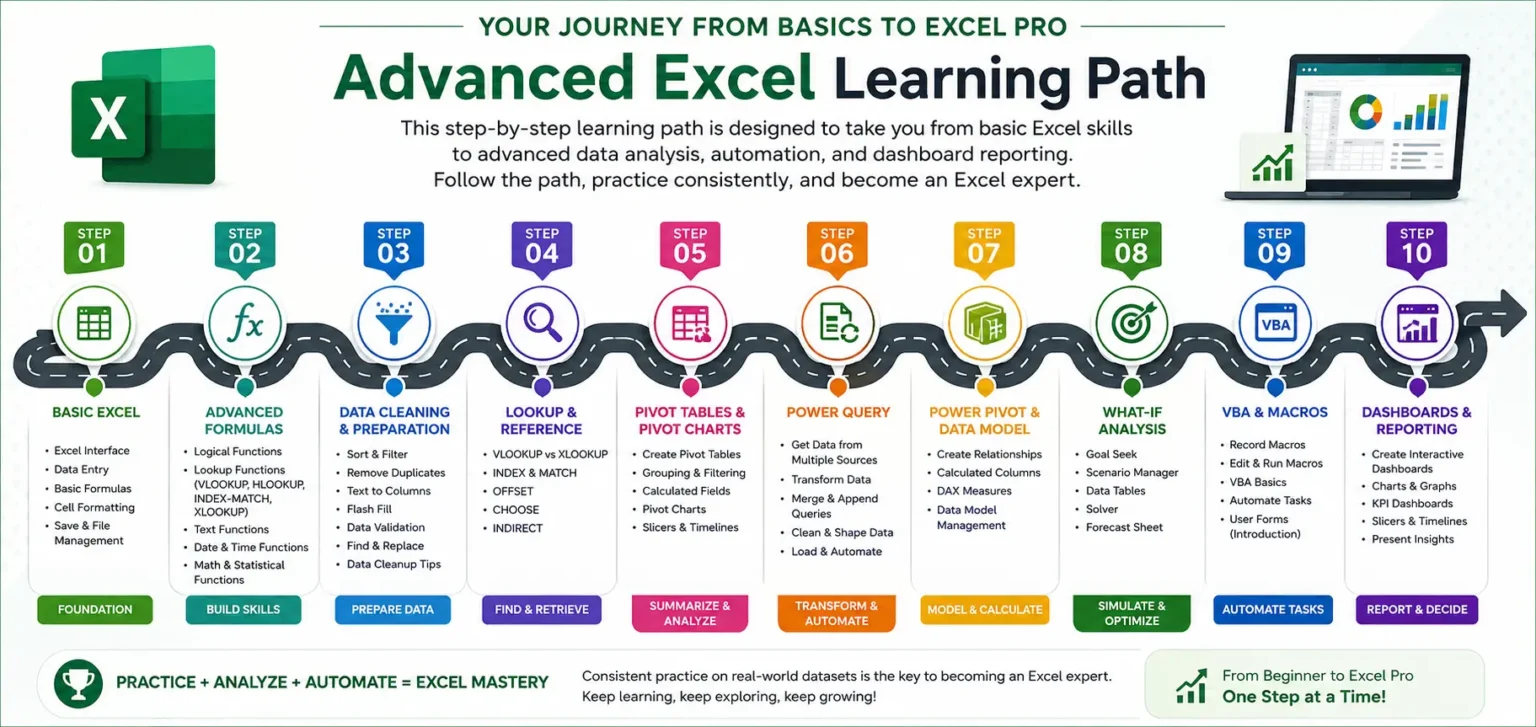
Advanced Excel Learning Path – From Basic Excel to Professional Data Analysis
Every learner follows a different journey, but mastering Advanced Excel becomes much easier when you learn the right concepts in the correct sequence. At C-Cube, our Advanced Excel Training in Kolkata follows a practical learning roadmap that gradually takes you from Excel fundamentals to advanced reporting, automation, dashboards, and data analysis. Each stage builds on the previous one, helping you develop confidence through hands-on practice and real-world business scenarios instead of simply memorising formulas.
🟢 Stage 1 – Build the Foundation 🔵 Stage 2 – Master Excel Functions 🟣 Stage 3 – Prepare & Clean Data 🟠 Stage 4 – Analyse with Lookup Functions 🟡 Stage 5 – Summarise with Pivot Tables 🟢 Stage 6 – Transform Data using Power Query 🔷 Stage 7 – Build Data Models 🟣 Stage 8 – Make Better Business Decisions 🔴 Stage 9 – Automate with VBA ⭐ Stage 10 – Create Dashboards & Reports
This structured Advanced Excel roadmap helps learners progress from Excel fundamentals to professional data analysis and reporting, ensuring every concept builds naturally on the previous one.
15 Excel Skills and Tools You Will Learn
Summarize, group, and analyze large datasets using interactive Excel Pivot Tables for faster business reporting.
Use Power Query in Excel to import, clean, transform, and combine data from multiple sources while reducing repetitive manual work.
Build relationships between datasets and perform Advanced Excel Data Modeling using Power Pivot and DAX concepts.
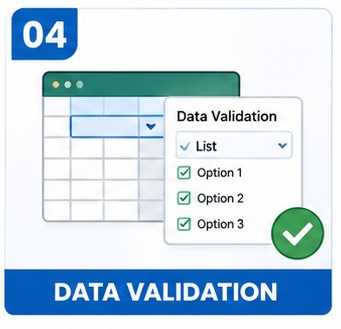
Create rules, dropdown lists, and input restrictions to improve Excel Data Accuracy and maintain consistent records.
Identify patterns, exceptions, and important values using Excel Conditional Formatting, colour scales, icons, and data bars.
Use Excel Solver to find optimal solutions for business problems involving costs, resources, targets, and constraints.
Apply Goal Seek in Excel to determine the input value required to achieve a specific formula result.
Compare possible business outcomes using Excel What-If Analysis, Scenario Manager, and changing input assumptions.
Perform Excel Scenario Analysis by testing multiple input values and comparing formula outcomes.
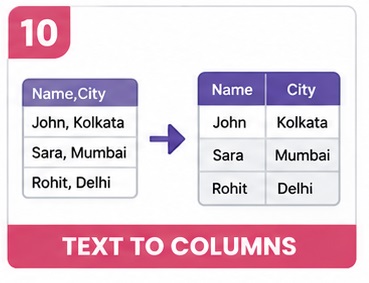
Clean and restructure imported data using Text to Columns in Excel based on delimiters or fixed-width data.
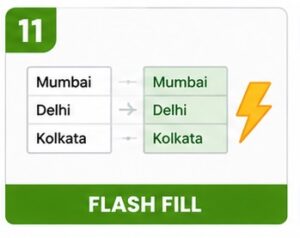
Use Excel Flash Fill to recognise patterns and automatically format or restructure repetitive data.
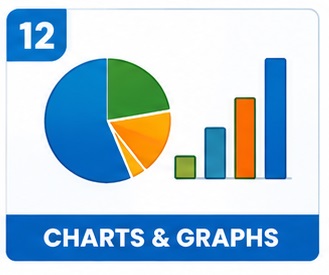
Transform raw information into meaningful Excel Data Visualizations using appropriate charts and graphs.
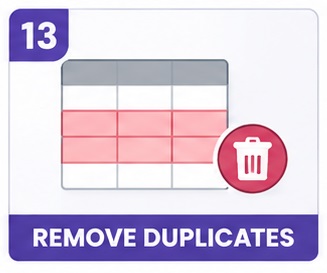
Improve Excel Data Cleaning by identifying and removing duplicate records from datasets.
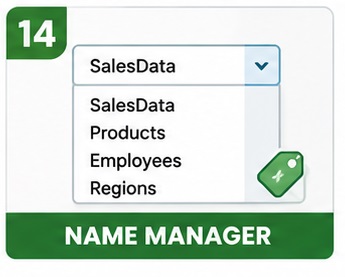
Create and manage Named Ranges in Excel to make complex formulas easier to understand and maintain.
Use Excel Flash Fill to recognise patterns and automatically format or restructure repetitive data.
Advanced Excel Course in Kolkata—Industry-Oriented Training Syllabus
Course Curriculum - Basic Excel
Module 1- Introduction to Microsoft Excel
- Introduction to spreadsheets
- Excel interface, Ribbon and Quick Access Toolbar
- Workbook and worksheet concepts
- Rows, columns, cells and ranges
- Creating, opening and saving workbooks
- Data entry and editing
- Insert, delete, move and copy cells
- Managing worksheets
Module 2 – Cell Formatting & Worksheet Design
- Font and alignment formatting
- Borders and fill
- Number formats
- Date, time, currency and percentage formats
- Custom number formatting – basics
- Format Painter
- Row height and column width
- Merge and Center
- Wrap Text
- Freeze Panes
- Page setup and printing
Module 3 – Basic Formulas & Cell References
- Introduction to formulas
- Arithmetic operators
- Order of calculation
- Relative cell reference
- Absolute cell reference
- Mixed cell reference
- Formula copying
- Common formula errors
Module 4 – Essential Excel Functions
- SUM
- AVERAGE
- MIN and MAX
- COUNT
- COUNTA
- COUNTBLANK
- ROUND
- ROUNDUP
- ROUNDDOWN
- INT
- MOD
- ABS
Module 5 – Logical & Conditional Functions
- IF
- Nested IF
- IFS
- AND
- OR
- NOT
- IFERROR
- IFNA
- Combining IF with AND and OR
Module 6 – Conditional Calculation Functions
- SUMIF
- SUMIFS
- COUNTIF
- COUNTIFS
- AVERAGEIF
- AVERAGEIFS
- Practical conditional calculations
Module 7 – Text Functions & Basic Data Cleaning
- LEFT
- RIGHT
- MID
- LEN
- FIND and SEARCH
- REPLACE and SUBSTITUTE
- TRIM
- CLEAN
- UPPER, LOWER and PROPER
- CONCAT
- TEXTJOIN
- VALUE and TEXT
- Flash Fill
- Find and Replace
- Remove Duplicates
Module 8 – Data Management Tools
- Sorting data
- Multi-level sorting
- Filtering data
- Custom filters
- Excel Tables
- Structured data basics
- Data Validation
- Drop-down lists
- Conditional Formatting
- Highlighting duplicate values
- Basic Named Ranges
Module 9 – Basic Charts & Reporting
- Column charts
- Bar charts
- Line charts
- Pie and Doughnut charts
- Area charts
- Chart elements and formatting
- Sparklines
- Selecting the correct chart
- Basic business reports
Advanced Excel
Module 1 - Advanced Lookup & Reference Functions
- VLOOKUP
- HLOOKUP
- XLOOKUP
- INDEX
- MATCH
- INDEX-MATCH combination
- XMATCH
- Exact and approximate lookup
- Two-way lookup
- Multiple criteria lookup
- CHOOSE
- OFFSET
- INDIRECT
- GETPIVOTDATA
Module 2 – Advanced Formula Techniques
- Complex nested formulas
- Multi-condition formulas
- Advanced IF logic
- XLOOKUP with multiple conditions
- INDEX-MATCH advanced scenarios
- Dynamic reporting formulas
- Formula auditing
- Trace Precedents and Dependents
- Evaluate Formula
- Error handling techniques
- Building business-oriented formulas
Module 3 –Advanced Data Management & Analysis
- Advanced Filter
- Complex sorting techniques
- Advanced Conditional Formatting
- Formula-based Conditional Formatting
- Advanced Data Validation
- Dependent drop-down lists
- Dynamic Named Ranges
- Subtotal
- Consolidation
- Data cleaning techniques
Module 4 –PivotTables & PivotCharts
- Creating PivotTables
- PivotTable field management
- Grouping data
- Value Field Settings
- Percentage analysis
- Running totals
- Ranking
- Calculated Fields
- Slicers
- Timelines
- PivotCharts
- GETPIVOTDATA
- Interactive business reports
Module 5 – Advanced Charts & Data Visualization
- Combo charts
- Waterfall charts
- Funnel charts
- Histogram
- Pareto charts
- Dynamic charts
- Target vs Achievement charts
- Variance charts
- Dashboard-oriented visualization
- Data storytelling principles
Module 6 – Excel Dashboard Development
- Dashboard planning and layout
- KPI selection
- Data preparation
- KPI cards
- Interactive charts
- Pivot-based dashboards
- Slicers and timelines
- Dynamic dashboard techniques
- Sales Dashboard
- HR Dashboard
- Financial Dashboard
- MIS Dashboard
Module 7 – Power Query – ETL & Data Transformation
- Introduction to Power Query
- Get & Transform Data
- Importing Excel, CSV and text files
- Data type management
- Removing and filtering rows
- Split and merge columns
- Replace Values
- Fill Down and Fill Up
- Conditional Columns
- Custom Columns
- Merge Queries
- Append Queries
- Group By
- Pivot and Unpivot
- Folder-based file consolidation
- Refreshable reports
- Introduction to ETL
Module 8 –What-If Analysis & Business Analytics
- Goal Seek
- Scenario Manager
- Data Tables
- Solver
- Forecasting
- Trend analysis
- Break-even analysis
- Budget variance analysis
- Sales performance analysis
- Business decision-making scenarios
Module 9 – Use of AI in Excel
- Column charts
- Bar charts
- Line charts
- Pie and Doughnut charts
- Area charts
- Chart elements and formatting
- Sparklines
- Selecting the correct chart
- Basic business reports
Course Duration
- Basic Excel - 1.5 Months
- Advanced Excel - 1.5 Months
Key Features
- Experienced Trainers
- 1 On 1 Training Option
- Small Batches
Mode of Training
- Offline
- Online
- Hybrid
Advanced Excel Training - Eligibility Criteria
- Graduates or Colleges Students from any discipline
- No prior work experience required
- No prior coding experience or tech know-how required
Best Suited For
- IT Professionals or Students
- Marketing Professionals
- Recent Graduates or students from any discipline.
Get Free Career Guidance Today
Career Opportunities After Advanced Excel Training
Learning Advanced Excel Skills for Jobs can support career opportunities across MIS reporting, data analysis, finance, operations, accounts, and business reporting. The right career path often depends on your educational background, additional technical skills, and ability to apply Excel to practical workplace tasks. Students who are interested to learn more about our Data Analytics Course can visit our course page for details or read our blog on Practical Data Analytics.
-
MIS Executive
Prepare daily, weekly, and monthly reports using Excel MIS Reporting Skills, Pivot Tables, lookup functions, dashboards, and structured business data.
Career Focus: MIS Reporting | Data Management | Business Reports
-
Data Analyst
Clean, organise, and analyse datasets using Excel Skills for Data Analysis, Pivot Tables, Power Query, formulas, charts, and reporting techniques.
Career Focus: Data Cleaning | Analysis | Reporting
-
Reporting Analyst
Build structured reports, track KPIs, and present business performance using Advanced Excel Reporting Skills and interactive dashboards.
Career Focus: KPI Reporting | Dashboards | Performance Analysis
-
Financial Analyst
Use Excel Skills for Financial Analysis to support budgeting, forecasting, financial modelling, scenario analysis, and business decision-making.
Career Focus: Budgeting | Forecasting | Financial Reports
-
Business Operations Executive
Manage trackers, analyse operational data, and improve reporting workflows using Excel for Business Operations and automation techniques.
Career Focus: Data Cleaning | Analysis | Reporting
-
Junior Business Analyst
Use Excel Skills for Business Analysis to examine data, compare business scenarios, identify patterns, and communicate findings through reports and visualisations.
Career Focus: Business Data | Scenario Analysis | Insights
Why Choose C-Cube For Advanced Excel in Kolkata
Learn from Experienced Mentors
Over the years, C-Cube Kolkata has guided students, graduates, job seekers, and working professionals from different backgrounds. Our training approach focuses on simplifying concepts, strengthening problem-solving skills, and helping learners apply Excel confidently in practical situations.
Practical Learning Through Projects
Apply Advanced Excel Skills through hands-on projects involving data cleaning, reporting, dashboards, and real-world business datasets
Flexible Learning Options
Whether you prefer classroom-based learning or instructor-led online sessions, the objective remains the same — providing a structured learning environment that supports consistent progress and practice.
Career Guidance and Interview Preparation
We help our students in Employability Skill Development through soft skills , resume building, GitHub portfolio guidance, mock interviews, and job placement preparation which helps them in building confidence.
Focus on Industry-Relevant Skills
Develop Industry-Relevant Excel Skills used in MIS, data analysis, finance, operations, and professional business reporting..
Advanced Excel Certification
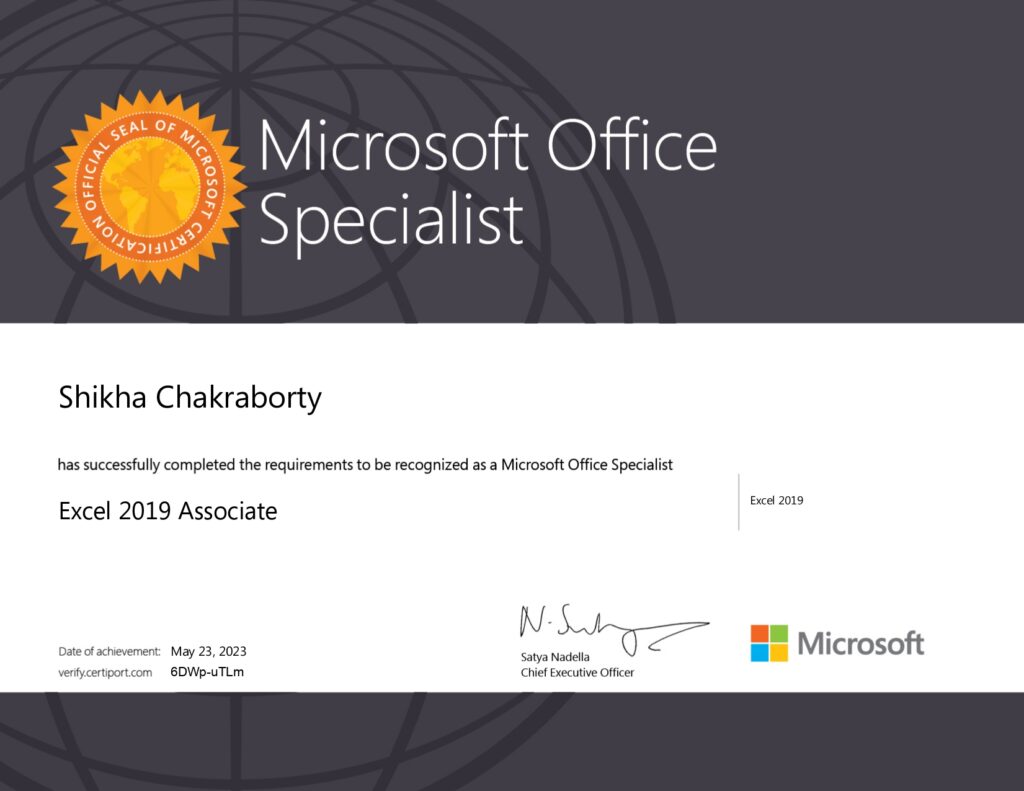
Successfully completing the Advanced Excel Training in Kolkata is more than learning Excel functions—it’s about gaining practical skills that employers value. After successfully completing the course and meeting the assessment requirements, students become eligible to receive a C-Cube Course Completion Certificate along with opportunities to earn Microsoft Global Certification through our recognised training partnership with Anudip Foundation and NBCE Skill Development Certification.
These certifications validate your practical knowledge of Advanced Excel, including data analysis, Pivot Tables, Power Query, dashboards, automation, and business reporting. They also strengthen your professional profile on platforms like LinkedIn and demonstrate your commitment to continuous learning while applying for roles in Data Analytics, MIS Reporting, Finance, Business Operations, and Office Administration.
At C-Cube, our focus is not just on awarding certificates but on helping students develop the practical Advanced Excel Skills needed to perform confidently in real workplace environments.
Hands-On Advanced Excel Projects
Learning Advanced Excel becomes meaningful only when you apply your knowledge to solve real business problems. As part of our Advanced Excel Training in Kolkata, students work on practical projects based on business, finance, HR, sales, and reporting scenarios. These projects help you strengthen your analytical thinking, improve reporting skills, and gain the confidence to use Excel effectively in real workplace environments.
If you are new to Excel or would like to understand the complete learning journey before joining the course, we recommend reading our How to Learn Advanced Excel in Kolkata – A Complete Roadmap for Beginners & Working Professionals, where we explain the step-by-step learning path, important tools, projects, and career opportunities in detail.
Design an interactive sales dashboard to analyse monthly revenue, product performance, regional sales, profit margins, and business growth trends. Learn how to build dynamic reports that help management monitor business performance through visual dashboards.
Tools Used
Pivot Tables
Pivot Charts
Slicers
Conditional Formatting
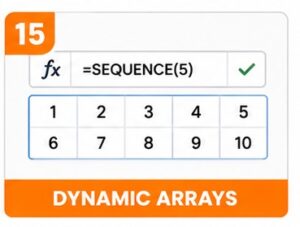
Dynamic Arrays
Develop an automated attendance and payroll management system that calculates working days, overtime, leave balance, incentives, and salary details. Generate MIS reports to simplify payroll processing and HR reporting.
Tools Used
IF Functions
XLOOKUP
Data Validation
Text to Columns
What-If Analysis
Goal Seek
Analyse customer purchase behaviour, identify high-value customers, evaluate sales trends, and generate business insights using advanced Excel reporting techniques. Create visual reports that support marketing and business decision-making.
Tools Used
Power Query
Power Pivot
Pivot Tables
Charts
Lookup Functions
Create a smart inventory management system to monitor stock availability, reorder levels, supplier details, product movement, and warehouse status. Automate inventory reports for faster business decisions.
Tools Used
Conditional Formatting
Power Query
Pivot Tables
Data Validation
Charts
What Students say about our Excel Training in Kolkata
Vedanta Poddar
I attended C-Cube to learn Excel and am extremely satisfied by the results. I have been able to greatly increase my understanding of the topic under the guidance given in the institution. All my doubts regarding the subject have been cleared and significant time and attention is given to each student.
Saptashwa Mitra
I have been studying at C-Cube Centre of Computer Education for the last 4 months and I have taken Advanced Excel course and my experience is extremely positive. All the teachers in this institute had helped me in every possible way to clear my concept and making difficult topics to easily understand.

Subhradeep Ghosh
I recently attended a Advanced Excel course at C-Cube, and I can confidently say it offers the best computer training I’ve ever experienced! The instructors are highly knowledgeable and passionate about teaching.This Excel course had helped me to improve my skills and knowledge and it had benefited me in many ways.

Frequently Asked Questions
Who should join the Advanced Excel Training Course in Kolkata?
Our Advanced Excel Training in Kolkata is suitable for students, graduates, working professionals, MIS Executives, Accounts professionals, Data Analysts, Business Analysts, Finance Executives, and anyone who wants to improve reporting, data analysis, and spreadsheet automation skills.
Do I need Basic Excel knowledge before joining the Advanced Excel Course?
Yes. A basic understanding of Excel—such as entering data, using simple formulas, and creating worksheets—is recommended. The course then gradually moves towards advanced formulas, Pivot Tables, dashboards, Power Query, and automation. In case if you have no basic knowledge of Excel , not to worry - we will train you on Basic Excel .
What Advanced Excel skills will I learn during the course?
You will learn:
- Advanced Formulas
- XLOOKUP
- INDEX & MATCH
- Pivot Tables
- Pivot Charts
- Power Query
- Power Pivot
- Dashboards
- Conditional Formatting
- Data Validation
- What-If Analysis
- Solver
- Excel Automation
Is Advanced Excel useful for Data Analytics?
Yes Advance Excel is very useful for Data Analytics.
Advanced Excel is one of the most important foundations for Data Analytics. Before learning SQL, Power BI, or Python, professionals use Excel for data cleaning, reporting, dashboard creation, Pivot Tables, and business analysis.
Does the course include practical projects?
Yes the course includes practical project.
Students work on practical datasets including sales reports, employee data, MIS reports, financial statements, inventory management, and dashboard projects to gain real-world Excel experience.
What job opportunities are available after learning Advanced Excel?
Advanced Excel skills are valuable for careers such as:
- MIS Executive
- Data Analyst
- Reporting Analyst
- Financial Analyst
- Accounts Executive
- Business Operations Executive
- Business Analyst
Will I learn Excel Dashboards and Power Query?
Yes Dashboards and Power Query are included in the course.
The course covers dashboard creation using Pivot Tables, charts, slicers, KPIs, along with Power Query for data cleaning, transformation, and automation.
Will I receive a certificate after completing the course?
After successfully completing the Advanced Excel Course, students will receive Certification from Microsoft Global Excel (MOS 200) and from NBCE.
Why should I choose C-Cube for Advanced Excel Training in Kolkata?
C-Cube combines practical classroom training, real-world projects, experienced trainers, job-oriented learning, individual attention, and over 25 years of training experience to help students develop industry-relevant Excel skills.