How to Learn Power BI from Scratch: A Beginner’s Roadmap to Data Analytics
Why Learn Power BI?
After more than 25 years of teaching computer and technology skills, I have seen that beginners often struggle not because Power BI is too difficult, but because they do not know what to learn first. They struggle because they often try to learn features one by one without understanding how those features fit into the actual process of working with data.
If you are also starting your journey in Data Analytics, knowing what to learn first—and why—can make a significant difference.
When you first explore Power BI, you may come across terms such as Power Query, data modelling, DAX, visualisation, reports and dashboards. It is natural to wonder where to begin. In my experience of guiding students, graduates, job seekers and working professionals, one common mistake is starting with charts and dashboards before learning how to prepare and understand the underlying data.
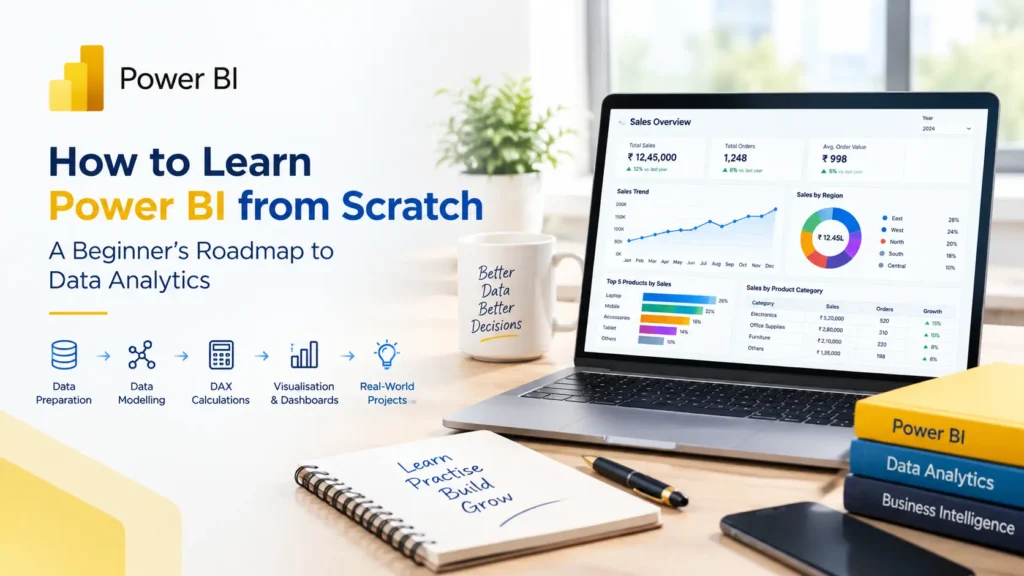
A useful Power BI report does not begin with a chart. It begins with a question, good-quality data and a clear understanding of what that data is telling you. That is why I recommend learning Power BI as a complete data journey:
Understand the data → Prepare the data → Build the model → Create calculations → Visualise the information → Build the dashboard → Communicate the business insight.
This guide follows that practical sequence. I will explain how to learn Power BI from scratch, what to focus on at each stage, which mistakes beginners commonly make, and how to gradually move from learning individual Power BI features to using the tool confidently for practical Data Analytics.
What Is Power BI and Why Is It Useful for Data Analytics?
Power BI is a business intelligence and data analytics platform used to connect data, prepare it, analyse it and present information through interactive reports and dashboards.
For a beginner, it is useful to think of Power BI as a process rather than simply a dashboard-making tool.
For example, imagine a company has sales data stored across several Excel files.
The analyst may need to:
- Import the data.
- Clean and transform it.
- Combine information from different tables.
- Build relationships between tables.
- Create calculations.
- Identify trends and patterns.
- Present the findings through reports and dashboards.
- Help decision-makers understand what the data is saying.
This is where Power BI becomes part of a wider data analytics workflow.
Microsoft’s beginner learning material similarly introduces Power BI through connecting to data, transforming data and creating interactive reports, while its data-analyst learning paths extend into modelling and DAX.
How to Learn Power BI from Scratch: The Right Learning Order
If you are wondering how to learn Power BI from scratch, my advice is simple: Do not try to learn every Power BI feature at once.
Follow a progressive roadmap.
A practical beginner sequence is:
Stage 1: Understand data and analytics
Stage 2: Learn Power BI fundamentals
Stage 3: Learn Power Query
Stage 4: Learn data modelling and relationships
Stage 5: Learn DAX
Stage 6: Learn data visualisation
Stage 7: Build Power BI dashboards
Stage 8: Learn reporting and sharing
Stage 9: Build Power BI projects
Stage 10: Connect your skills with real business problems
This sequence is also broadly consistent with Microsoft’s current learning structure, which separates preparing data, modelling data, DAX and reporting into progressive learning areas.
For someone completely new to Power BI, this is a much more manageable approach than attempting advanced features immediately.
Stage 1: Understand Data Before Learning Power BI
Before opening Power BI, understand what you are actually trying to analyse.
You do not need to become a statistician before learning Power BI. But you should understand basic concepts such as:
- rows and columns
- data types
- categories
- numerical values
- dates
- totals and averages
- KPIs
- trends
- comparisons
- business questions
For example, instead of simply saying, “I want to create a sales dashboard.”ask,”Which products are selling the most?”
“Which region is performing below target?” , “How has sales changed month by month?” and “Which customer segment contributes the most revenue?” These questions determine what data you need and which visualizations will actually be useful.
Mentor Tip
Start with the question, not the chart. A Power BI report should help answer a question. The visual is only the method of communicating the answer.
Stage 2: Learn Power BI Fundamentals
Once you understand basic data concepts, start learning the Power BI environment. A beginner should become comfortable with:
- Power BI Desktop
- reports
- tables
- fields
- visuals
- filters
- slicers
- report pages
- basic interactions
- importing simple Excel or CSV data
At this stage, do not worry about mastering DAX or advanced data modelling. Your first objective is simply to understand how data moves into Power BI and how a basic report is created. Microsoft’s current beginner learning path recommends starting with Power BI fundamentals, connecting data and creating a first report before moving into more advanced areas.
What should you be able to do after this stage?
You should be able to:
- import a simple dataset
- identify columns and data types
- create basic charts
- add a slicer
- apply filters
- create a simple report page
- explain what the report is showing
That is enough for your first milestone.
Stage 3: Learn Power Query for Data Preparation
This is one of the most important stages of the entire Power BI learning roadmap. Many beginners want to jump directly to dashboards. In real-world work, however, data is rarely ready to use.
You may encounter:
- duplicate records
- missing values
- incorrect data types
- inconsistent names
- unnecessary columns
- multiple files
- poorly formatted dates
- data stored in different tables
This is where Power Query becomes important.
Power Query helps you connect to data and clean, transform and prepare it before analysis. Microsoft specifically identifies Power Query as a core part of preparing and cleaning data for Power BI analysis.
What should you learn in Power Query?
- importing data
- changing data types
- removing duplicates
- removing unnecessary columns
- handling errors
- replacing values
- splitting columns
- merging queries
- appending queries
- filtering data
- pivoting and unpivoting data
- understanding Applied Steps
Mentor Tip
Do not think, “Power Query is only for cleaning.” Think: “Power Query prepares the data so that the analysis becomes reliable.”
If the source data is poorly prepared, even a beautiful dashboard can communicate the wrong information.
Stage 4: Learn Data Modelling and Relationships
After preparing the data, you need to understand how different tables work together. This is called data modelling.
Suppose you have:
- Sales table
- Customer table
- Product table
- Date table
These tables contain different types of information. Your Power BI model needs appropriate relationships between them so that calculations and reports work correctly.
Microsoft’s Power BI modelling learning path describes data modelling as organising prepared data into a semantic model with relationships and calculations, setting the foundation for accurate reporting.
Beginners should understand:
- tables
- relationships
- primary and related fields
- one-to-many relationships
- fact and dimension concepts
- date tables
- measures
- basic model structure
You do not need to memorise every modelling concept on day one. Instead, take two or three related tables and practise connecting them.
Example -Imagine: Customers → Sales → Products
Now ask: Can I analyse sales by customer? Can I analyse sales by product? Can I compare sales by month?
If your model is designed correctly, these questions become much easier to answer.
Mentor Tip
A dashboard problem is sometimes actually a data-model problem.
If a calculation gives an unexpected result, do not immediately blame DAX. First check whether the underlying tables and relationships are correct.
Stage 5: Learn DAX Step by Step
After learning the basics of modelling, start learning DAX — Data Analysis Expressions. This is where many beginners become nervous. My advice is: do not try to memorise hundreds of DAX functions.
Start with a small group of practical calculations. For example:
- SUM
- COUNT
- DISTINCTCOUNT
- AVERAGE
- CALCULATE
- FILTER
- basic date calculations
DAX allows Power BI users to create calculations and derive additional information from the data model. Microsoft recommends learning DAX through actual calculations and data rather than treating it as a purely theoretical subject.
Start with simple business questions.
Instead of learning, “What does CALCULATE do?”
Start with: “How can I calculate total sales?” Then: “How can I calculate sales for a particular year?” Then: “How can I calculate year-over-year growth?”
This makes DAX easier to understand because every calculation has a purpose.
Measures vs Calculated Columns
As you progress, learn the difference between:
- calculated columns
- measures
- calculated tables
Do not rush into advanced DAX until you understand these fundamentals.
Mentor Tip
Learn DAX by solving business questions, not by memorising formulas.
Microsoft’s own DAX learning material uses practical calculations and real data to introduce DAX concepts.
Stage 6: Learn Data Visualisation
Now you are ready to think more seriously about data visualisation. Power BI provides many types of visuals, but knowing where to find a chart is not the same as knowing when to use it.
| Business question | Possible visual |
|---|---|
| How are sales changing over time? | Line chart |
| Which products sell the most? | Bar chart |
| How does one category compare with another? | Column/bar chart |
| Where are sales coming from? | Map or appropriate categorical visual |
| Which KPIs need attention? | KPI/card visuals |
| How do several metrics compare? | Combination of appropriate visuals |
The important skill is not: “I know 20 chart types.” The important skill is: “I know which visual helps communicate this particular business question.”
Avoid the dashboard decoration trap
Beginners sometimes put on one page.
- five colours
- ten charts
- multiple cards
- unnecessary icons
- complicated backgrounds
That does not automatically make a report useful. A good report should make the important information easier to understand.
Stage 7: Learn How to Build Useful Power BI Dashboards
Once you understand data preparation, modelling, DAX and visualisation, start creating complete Power BI dashboards.
A useful dashboard should help someone answer questions quickly. For example, a sales dashboard could show:
- total sales
- profit
- sales by region
- sales by product
- monthly trend
- top customers
- target versus actual performance
But don’t simply place these visuals on a page. Ask these below questions first:
Who is going to use this dashboard?
What decisions do they need to make?
Which information should they see first?
What should they be able to filter?
This is where Power BI dashboard training becomes more than learning how to drag and drop visual elements.
A practical dashboard structure
Top: Important KPIs
Middle: Trends and comparisons
Bottom: Detailed analysis
Side/top: Filters and slicers
The exact design will depend on the business problem.
Mentor Tip
A dashboard should reduce the time needed to understand a business situation.
If users need five minutes to understand what the dashboard is saying, the design probably needs improvement.
Stage 8: Learn Business Reporting and Insight Communication
Power BI is not only about creating charts. A professional analyst also needs to communicate what the data means.
Suppose your dashboard shows: Sales decreased by 12% in one region.
The next question should be: Why?
You may need to investigate the below factors:
- product performance
- customer segments
- sales channels
- monthly trends
- regional performance
- discounts
- targets
This is where Power BI becomes connected with business reporting and decision-making. Think beyond the number.
Instead of presenting: Sales = ₹45 lakh , try to understand: Sales increased by 8% compared with the previous period, mainly because of stronger performance in two product categories.
The second statement provides context.
That is an important step in becoming a better Data Analyst.
Stage 9: Build Power BI Projects, Not Just Exercises
If you want to develop genuine Power BI skills, projects are essential. Watching tutorials can help you understand features. But projects make you solve problems.
Start with simple Power BI projects such as:
1. Sales Dashboard
Analyse the following:
- sales
- profit
- products
- regions
- monthly trends
2. HR Dashboard
Analyse the following:
- employee count
- departments
- attrition
- gender distribution
- experience
3. Financial Dashboard
Analyse the following:
- revenue
- expenses
- profit
- monthly performance
- budget versus actual
4. Marketing Dashboard
Analyse the following:
- campaigns
- leads
- conversion
- channels
- customer acquisition
Stage 10: Move from Practice Datasets to Real-World Power BI Projects
Once you are comfortable with basic dashboards, don’t keep working only with perfectly prepared datasets. Try real-world Power BI projects where the data is incomplete, inconsistent or spread across multiple tables.
That is where you begin to practise:
Data preparation → Power Query → Data modelling → DAX → Data visualisation → Dashboard → Business insight
Project documentation matters. For every project, record the following:
- Business problem
- Data sources
- Data cleaning steps
- Data model
- Important calculations
- Visualisation choices
- Key insights
- Final recommendations
This creates a much stronger portfolio than simply uploading screenshots of dashboards.
Mentor Tip
Don’t build a dashboard just to show that you know Power BI. Build a project that demonstrates that you can use Power BI to solve a data problem.
Stage 11: Understand Where Power BI Fits into a Data Analyst Career
Power BI is an important skill, but it should not be treated as the entire Data Analytics profession. A Data Analyst may also need some understanding of:
- Excel
- SQL
- statistics
- data cleaning
- business communication
- reporting
- domain knowledge
Power BI can become the layer through which prepared data is analysed and communicated. Microsoft’s current Power BI learning paths explicitly connect Power BI with the Data Analyst role and data analytics.
What Power BI skills can support?
Depending on the role and employer, Power BI skills can be useful in areas such as:
- Data Analyst
- Business Intelligence Analyst
- Reporting Analyst
- MIS reporting
- business reporting
- operations analysis
- management reporting
The important point is that Power BI is usually one part of a broader professional skill set.
What Power BI Skills Should a Beginner Learn First?
If you are starting from zero, don’t try to learn everything simultaneously. I would prioritise your learning in this order:
| Priority | Skill | What to learn |
|---|---|---|
| 1 | Power BI Fundamentals | Interface, data, reports and visuals |
| 2 | Power Query | Import, clean and transform data |
| 3 | Data Modelling | Tables and relationships |
| 4 | DAX | Measures and calculations |
| 5 | Data Visualisation | Choosing useful visuals |
| 6 | Power BI Dashboards | Interactive report design |
| 7 | Business Reporting | Communicating insights |
| 8 | Projects | Applying the complete workflow |
Do You Need Excel or SQL Before Learning Power BI?
Do I need Excel?
Excel knowledge is helpful, especially if you already work with spreadsheets, formulas, tables and business reports. But you do not need to be an advanced Excel user before starting Power BI. To learn more about Advanced Excel Training in Kolkata students can explore our Excel Course.
Microsoft’s beginner Power BI material does not require prior Power BI experience, and its DAX material notes that Excel formula knowledge can be helpful but is not a prerequisite.
Do I need SQL?
No, you can start learning Power BI without SQL. However, SQL becomes valuable as you progress toward broader Data Analytics and work with relational databases.
Mentor Advice
If you are completely new: Start Power BI now.
Then gradually add: Excel → SQL → Statistics → Business Understanding
according to the type of Data Analytics role you want to pursue.
How Should Students and Working Professionals Learn Power BI?
The learning approach can be different depending on your starting point.
Students should focus on the following:
- fundamentals
- Power Query
- data modelling
- DAX
- dashboards
- projects
- portfolio development
Working professionals should focus on the following:
Start with the Power BI tasks closest to your current work. For example:
Finance professional → financial reporting
HR professional → HR analytics
Sales professional → sales dashboards
Operations professional → operational reporting
This makes learning more relevant because you are connecting Power BI skills with problems you already understand.
That is why Power BI training for students and working professionals should not necessarily follow exactly the same practical examples for every learner.
How to Choose a Power BI Course for Beginners?
If you are comparing a Power BI course in Kolkata or an online programme, don’t choose only on the basis of course duration or the number of topics listed.
Look at what you will actually practise. Check whether the course covers the following:
- Power BI fundamentals
- Power Query
- data modelling
- relationships
- DAX
- data visualisation
- dashboards
- business reporting
- projects
- publishing and sharing
- practical datasets
Also examine the Power BI course curriculum carefully. A long list of topics does not automatically mean that you will develop practical skills.
Ask these questions below before joining
- Will I work with real datasets?
- Will I clean messy data?
- Will I build relationships between tables?
- Will I create DAX measures?
- Will I build complete dashboards?
- Will I complete projects independently?
- Will I receive feedback on my work?
- Will I understand why a particular visual or calculation is being used?
These questions tell you much more about the learning experience than simply asking how many hours the course contains.
A Practical Power BI Learning Roadmap
If I had to advise a beginner personally, I would keep the roadmap simple:
Month 1 — Foundations
- Power BI interface
- importing data
- basic reports
- filters
- slicers
- simple visualisation
Month 2 — Data Preparation
- Power Query
- data cleaning
- transformation
- combining data
- handling errors
- data types
Month 3 — Modelling and DAX
- relationships
- data models
- measures
- calculated columns
- basic DAX
- business calculations
Month 4 — Dashboards and Projects
- dashboard design
- interactive reports
- KPIs
- business reporting
- publishing/sharing
- complete Power BI projects
Interested Students can also explore our Data Analyst Roadmap here for in-depth knowledge.
From Learning Power BI to Becoming a Better Data Analyst
Learning Power BI is not the finish line. It is one step in becoming comfortable with data. As you progress, try to develop the ability to move through this chain:
Business Question
↓
Data
↓
Data Preparation
↓
Data Modelling
↓
DAX Calculation
↓
Data Visualisation
↓
Power BI Dashboard
↓
Business Insight
↓
Decision
That is the real skill behind good data analytics. A person who knows 50 Power BI features but cannot explain what a dashboard means may struggle in a real business environment.
In real-world work, it is not enough to know Power BI. You also need to understand the business problem, analyse the data properly, and explain what the results actually mean.
Frequently Asked Questions
Is Power BI difficult for beginners?
Power BI can feel complicated initially because it combines data preparation, modelling, calculations, and visualisation. However, learning these areas in a logical order makes the process much easier.
Can I learn Power BI from scratch?
Yes. You can start without previous Power BI experience. Basic familiarity with data or spreadsheets can help, but the most important factor is regular hands-on practice.
Is Power BI useful for Data Analytics?
Yes. Power BI is closely connected with data analytics, reporting, data visualisation and business intelligence. It can be one important component of a broader Data Analyst skill set.
Do I need Excel before learning Power BI?
No. Excel experience is helpful, but advanced Excel knowledge is not required to begin learning Power BI.
Do I need SQL before Power BI?
No. You can learn Power BI without SQL. However, SQL is a valuable complementary skill for many Data Analyst roles.
What should I learn first in Power BI?
Start with Power BI fundamentals and data preparation. Then move to Power Query, data modelling, DAX, visualisation and dashboards.
Is DAX difficult to learn?
DAX can become challenging as calculations become more advanced. Start with simple measures and business questions rather than trying to memorise large numbers of formulas.
How many Power BI projects should I build?
There is no fixed number. A few well-documented projects that demonstrate different skills can be more useful than many unfinished dashboards.
Can Power BI help with Power BI jobs?
Power BI skills can be relevant to roles involving data analysis, business intelligence, reporting and dashboard development. However, employers may also expect skills such as Excel, SQL, statistics, communication or domain knowledge.
Is Power BI suitable for students and working professionals?
Yes. Students can use Power BI to build foundational data analytics and portfolio skills, while working professionals can apply it to reporting and analysis within their existing domain.
Final Mentor Advice: Don’t Learn Power BI Just to Make Dashboards
If you remember only one thing from this guide, remember this: Power BI is not simply a dashboard tool. Learn how to understand the data.
Learn how to prepare it.
Learn how tables relate to each other.
Learn how DAX answers business questions.
Learn how to choose the right visual.
Then build dashboards.
And finally, learn how to explain what the data is telling you.
If you follow that sequence, your Power BI learning becomes much more meaningful. You are not simply learning software.
You are developing the ability to turn data into information and information into useful business insight.
Want to Continue Your Power BI Learning?
If you are looking for structured guidance after exploring this roadmap, you can learn more about Power BI Training in Kolkata at C-Cube Centre of Computer Education, where the learning approach focuses on data preparation, Power Query, data modelling, DAX, visualisation, dashboards and practical projects.
You can also explore Data Analytics Training in Kolkata to understand how Power BI fits into a broader Data Analytics skill set that can include Excel, SQL, Python, statistics and project work.
About the Author
Sudipta Chakraborty

Sudipta Chakraborty is the Centre Director and senior faculty mentor at C-Cube Centre of Computer Education, Kolkata, with more than 25 years of experience in computer education, student mentoring, and career-oriented skill development. He regularly writes about Data Analytics, emerging technologies, career trends, and practical learning approaches to help students and professionals make informed career decisions.
Readers interested in understanding more about the author’s professional background and experience in computer education can also connect through LinkedIn
For Free Counseling Call – 9007116752
Our Recent Blogs
- How to Learn Power BI from Scratch: A Beginner’s Roadmap to Data Analytics
- C-Cube Partners with Medhavi Foundation: A New Step Towards Skill-Based Certification

- How to Learn Advanced Excel in Kolkata: A Complete Roadmap for Beginners and Working Professionals
- Top Data Analytics Interview Questions for Freshers in 2026 (With Practical Answers)
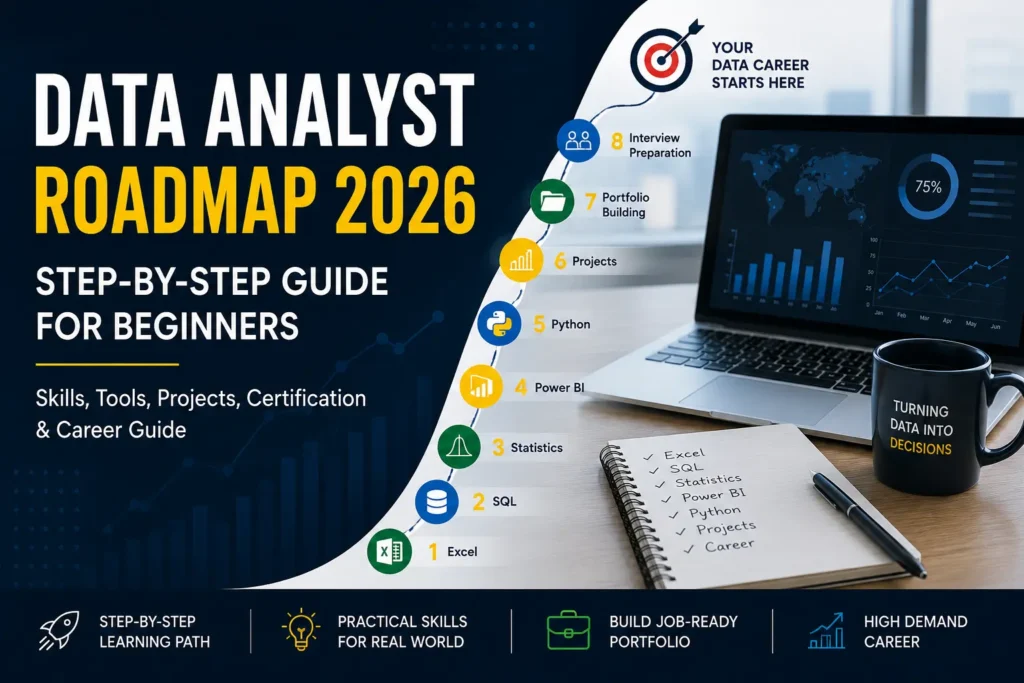
- Data Analyst Roadmap 2026 – Step-by-Step Learning Guide for Beginners
- How Beginners Can Start Learning Data Analytics in Kolkata
- Why Students in Kolkata Are Choosing Data Analytics as a Career in 2026 ?

- Top 10 Computer Courses in Kolkata for Career Growth in 2026

- 25 Years of C-Cube Centre of Computer Education – Building Skills, Careers, and Trust in Kolkata