
9007116752
c3creativedomain@gmail.com
C-Cube
Centre of Computer Education
- Courses
- Best Data Science Training Institute
- Data Science with R
- Financial Data Analytics
- Data Analytics Training in Kolkata
- Full Stack Development Course Kolkata
- Website Development
- Android App Development
- Programming Training Institute
- Institute For Cyber Security kolkata
- Data Structure & Algorithm
- Digital Marketing Course
- Best Spoken English Institute in Kolkata | C-Cube
- Marketing Analytics Training in Kolkata
- Share Trading Institute
- F.A & Ms-Office
- About Us
- Contact Us
- Blog
- Gallery
Data Analytics Training in Kolkata
- Learn to work with data using Advanced Excel, SQL, Power BI, Python and Statistics through a structured programme at C-Cube Centre of Computer Education, Kolkata.
- The course is designed for beginners, graduates and working professionals who want to build practical data analysis skills. You will learn how to prepare data, analyse information, create reports and dashboards, and present findings through guided exercises and projects.
Enquire about the course and discuss the learning plan that suits your background and goals.
Quick Contact Form
Course Duration
8 Months (Course) + 1 Month Project
Tools Covered
Python , SQL , Advanced Excel , Power BI & Statistics
Learning Mode
Classroom | Online | Hybrid. (All available)
Batch Format
Small Batch Size – 1 To 1 Option Available
Career & Interview Support
Resume guidance & mock interviews
What You'll Learn in Our Data Analytics Training
Understand the complete analytics process—from preparing data and answering business questions to creating dashboards and explaining what the numbers mean.
Learn the tools as part of real data work
Data analytics is the process of collecting data, cleaning it, analysing it, finding useful patterns and explaining what those findings mean so better decisions can be made.
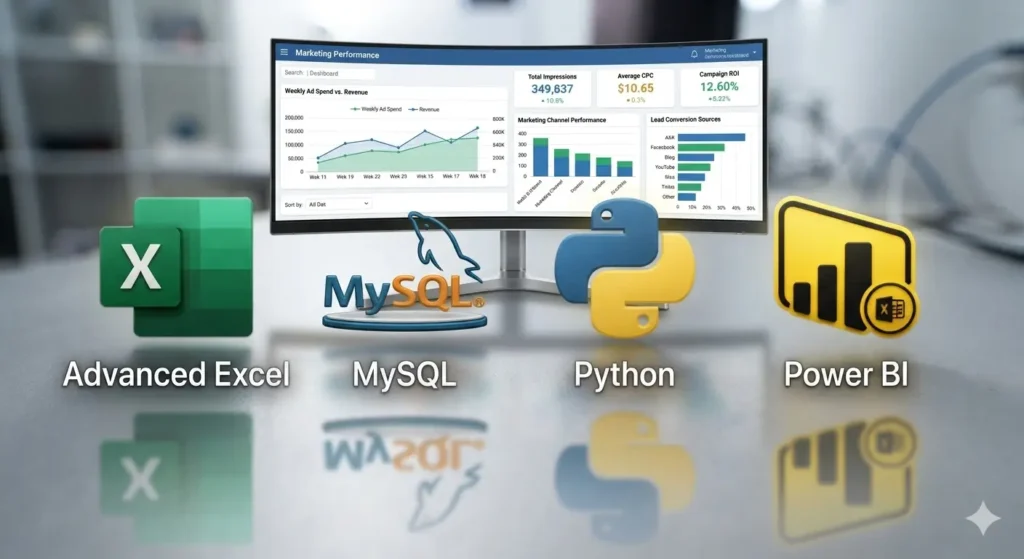
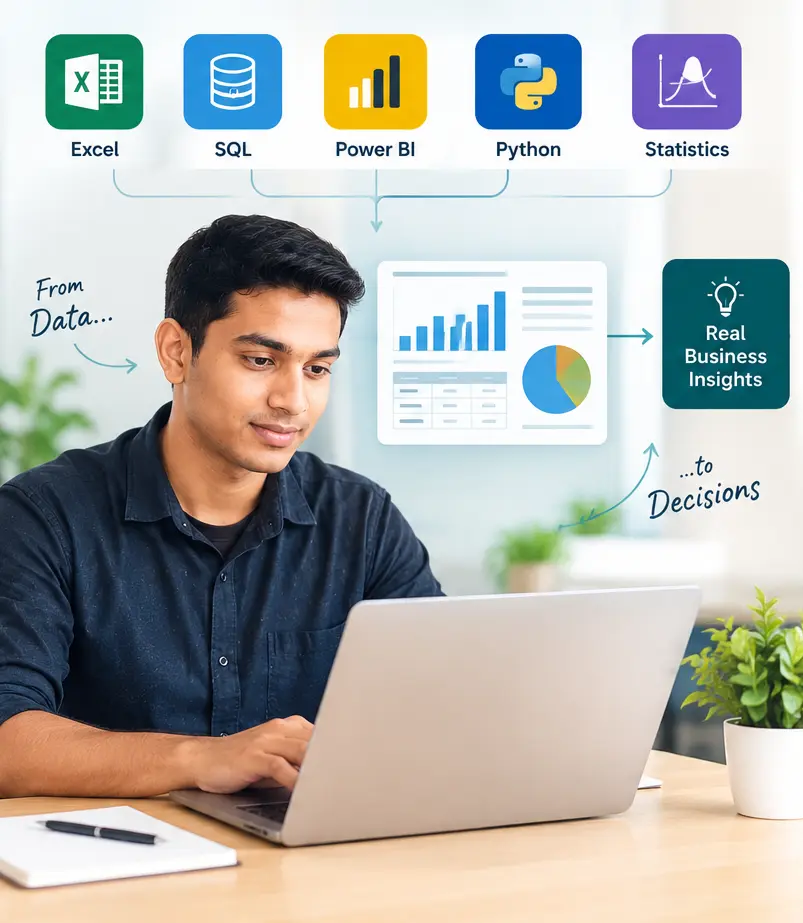
At C-Cube, the training is designed around that process rather than treating each software tool as a separate subject. You work with Advanced Excel, SQL, Power BI, Python and Statistics, with practical exercises and projects connecting the skills.
Advanced Excel
Clean and organise data, work with formulas and lookups, use PivotTables and create practical reports and dashboard-style analysis.
MySQL
Retrieve, filter, join and summarise data from relational databases while solving practical business questions.
Power BI
Use Power Query, data modeling, and DAX to turn prepared data into clear, interactive business reports.
Python
Build a foundation in Python for data analysis using tools such as Pandas and visualisation libraries.
Statistics
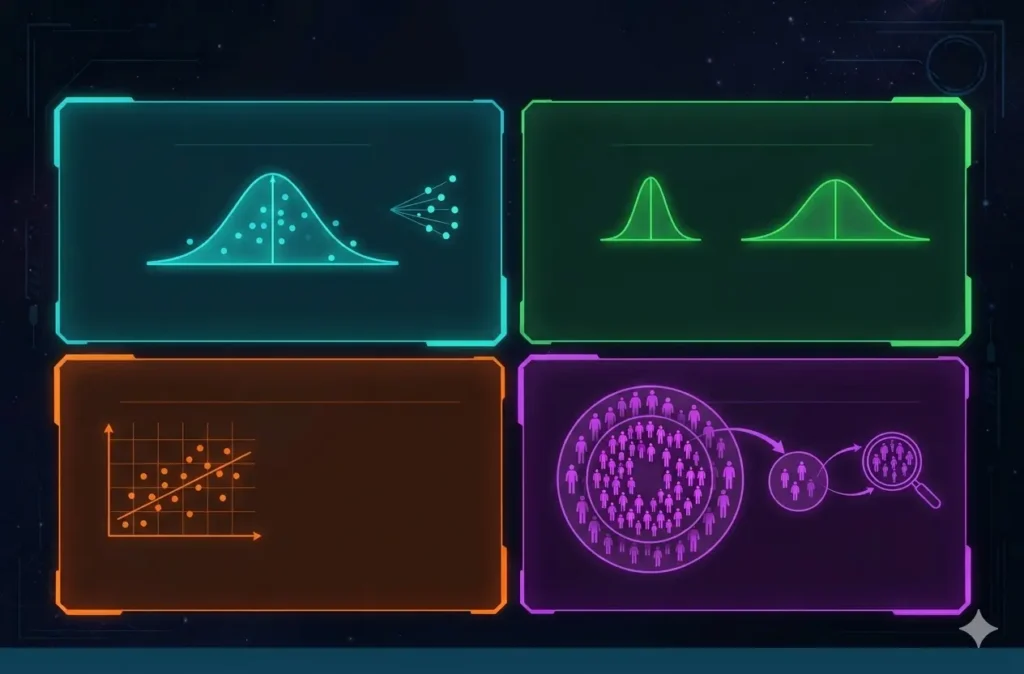
Understand averages, spread, correlation, sampling and interpretation so you can read results sensibly.
What This Course Will and Won’t Do
It will teach the full workflow
You prepare data in Excel, query it with SQL, build dashboards in Power BI, and use Python for larger or repeated work.
It will give you work to show
You complete 4 guided projects, such as sales, customer, HR or operations, and financial analysis, that you can explain in interviews.
It won’t guarantee a job
Outcomes depend on your practice, your projects, your background, and the job market.
It won’t make you a data scientist
Machine learning isn’t part of this course. If that’s your goal, see our course page. Analytics is a sensible first step.
How the tools work together
1
Prepare Dataset
Clean and organise raw data in Excel.
2
Retrieve & Analyse
3
Explore & Automate
Use Python and pandas where Excel gets slow or the task repeats.
4
Visualise
Build reports and dashboards in Power BI.
5
Communicate
Explain your findings and recommendations in a short summary.
What You Will Be Able to Build After This Program
- Excel-based analytical reports
- SQL-based data queries and business reports
- Power BI dashboards and interactive reports
- Sales and customer analysis reports
- HR / operations reporting dashboards
- Business performance summaries and insights
- Four guided practical projects for your portfolio
Data Analytics Course Syllabus
Module 1 - Advanced Excel
- Data cleaning and formatting
- Logical, lookup, text and date functions
- Pivot Tables and Pivot Charts
- Conditional formatting and data validation
- MIS reports, summaries and interactive dashboards
- Practical Excel-based analysis
Module 2 – SQL for Data Analysis
- Database and relational table fundamentals
- SELECT, WHERE, ORDER BY and filtering
- Aggregate functions and GROUP BY
- Joins and subqueries
- Common Table Expressions and window functions are included in the programme
- Data retrieval and analysis using MySQL
- Solving practical questions with SQL queries
Module 3 –Python for Data Analysis
- Python fundamentals, including variables, conditions, loops and functions
- Lists, dictionaries and other data structures
- NumPy fundamentals
- Data handling and analysis using Pandas
- Data cleaning, filtering and aggregation
- Exploratory Data Analysis
- Charts and visualisation using Matplotlib and other taught libraries
Module 4 –Power BI for Reporting and Visualisation
- Power BI interface and data connections
- Data cleaning and transformation using Power Query
- Data modelling and relationships
- DAX fundamentals, measures and calculations
- Visualisation and interactive reports
- KPIs, filters and drill-through
- Dashboard development and report sharing
Module 5 – Statistics for Data Analysis
- Types of data and data collection
- Mean, median and mode
- Range, variance and standard deviation
- Basic probability and sampling
- Correlation and trend analysis
- Data interpretation and common analytical errors
Module 6 – Practical Projects and Case Studies
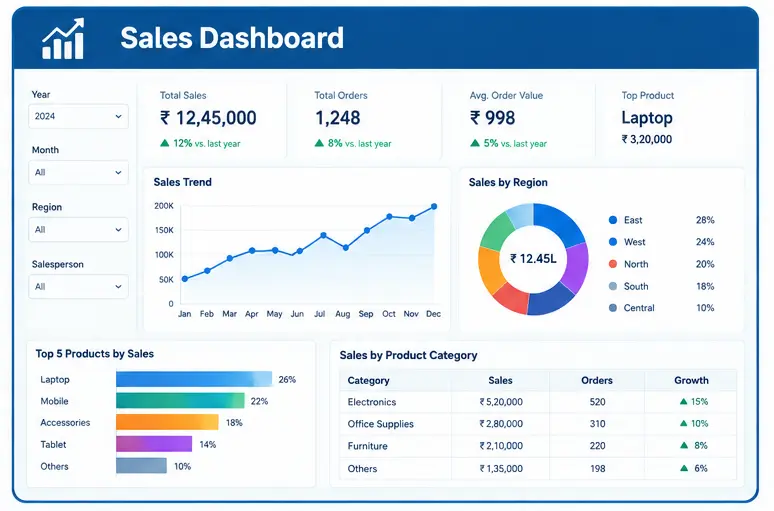
- Sales data analysis and dashboard reporting
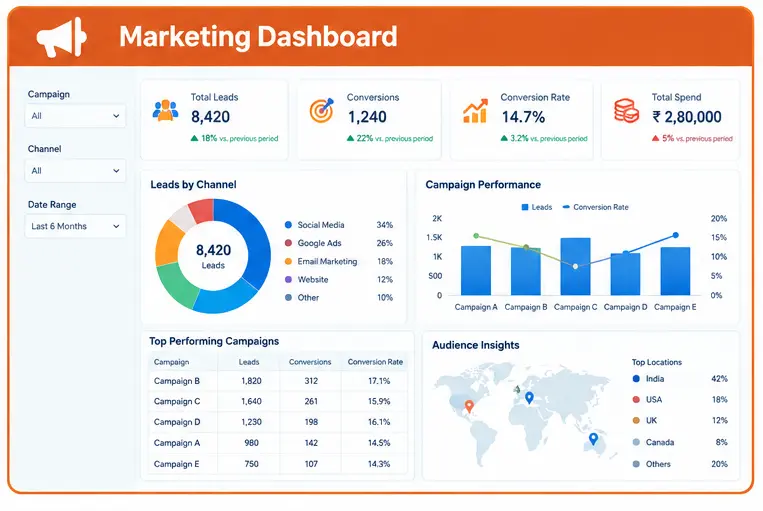
- Customer and retail data analysis
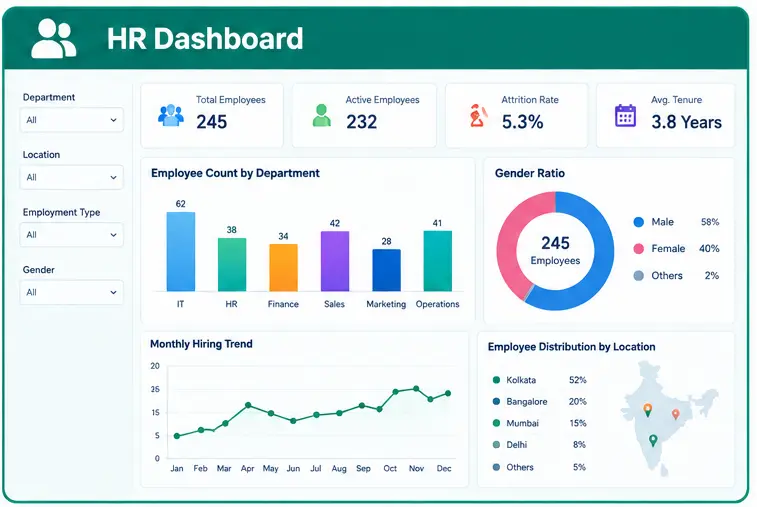
- HR or operations reporting
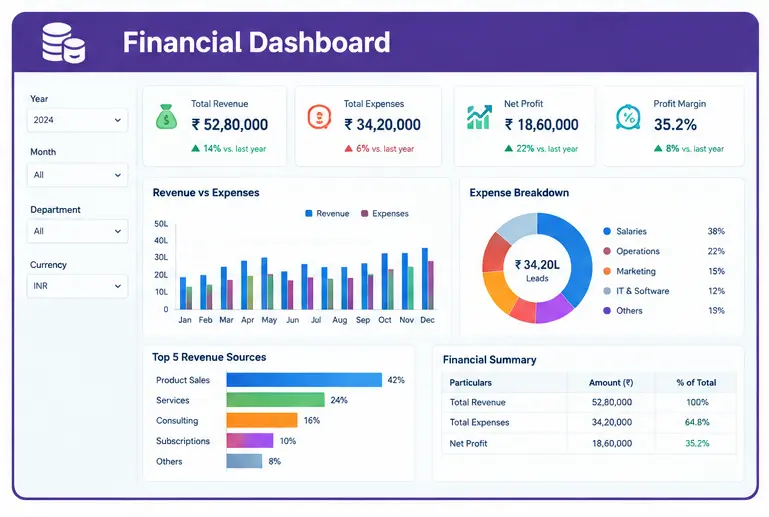
- Financial or business performance analysis
- A guided project that combines relevant tools and analytical steps
Practical Projects You Will Work On
Sales Analysis
Compare sales across products, regions and time periods, identify patterns and present the results in a dashboard.
Customer Analysis
Examine purchasing patterns and customer groups using suitable summary measures and queries.
HR Reporting
Analyse selected workforce or operational measures and prepare a report.
Financial reporting
Organise revenue and expense data and present relevant performance indicators.
Career Paths After Data Analytics Training
The actual role you can pursue will depend on your educational background, practical skills, projects, interview performance and employer requirements.
-
MIS Executive
Preparing recurring reports and summarising business information.
-
Junior Data Analyst
Cleaning, querying and analysing datasets to answer business questions.
-
Business Analyst
Supporting business decisions through data, reporting and domain knowledge.
-
Reporting Analyst
Producing reports and tracking key measures.
-
Junior BI or Dashboard Reporting roles
Building and maintaining reports using tools such as Power BI.
Who Can Join the Data Analytics Course?
-
Beginners who want to start learning data analysis.
-
Graduates and Final-Year students from Commerce, Science, Arts, Management, Engineering and other Disciplines.
-
Working professionals in accounts, finance, sales, marketing, HR, operations or MIS who want to improve their reporting and analysis skills.
-
Learners considering a move towards entry-level data-related roles.
Learn the tools.
Understand the process.
Build Your Future.
Career Guidance and Interview Preparation
Along with technical training, C-Cube supports learners with employability preparation, where included in the programme.
- Resume and CV guidance
- Mock interview practice
- Communication and presentation activities
- Group discussion practice
- Guidance on explaining project work during interviews
Certification Options
Medhavi Foundation certification
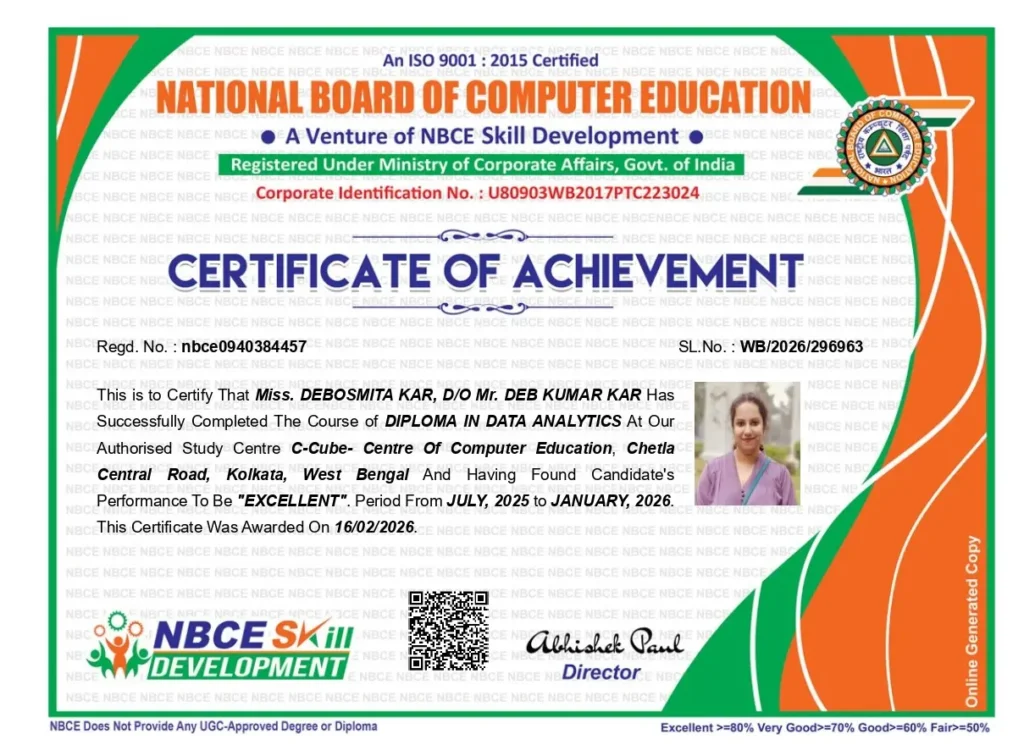
C-Cube is associated with Medhavi Foundation as a Skill Certification Partner. Eligible learners will receive the applicable Medhavi Foundation certification after meeting the relevant course, assessment and certification requirements.

NBCE certification
Eligible learners may also pursue the applicable NBCE certification after completing the required course work and examination, subject to the relevant certification requirements.
Why Learn Data Analytics at C-Cube Kolkata
Learn from Experienced Mentors. Build Real Skills. Shape Your Future.
At C-Cube, Data Analytics training goes beyond learning software. Students receive structured guidance, practical learning, project work and career preparation through an educator-led training approach.
C-Cube has been providing computer education and skill-focused training in Kolkata for more than 25 years.
.
25+ Years of Computer Training, Led by an Experienced Director
Sudipta Chakraborty
Founder & Centre Director
Senior Data Analytics Training Mentor
LinkedIn Profile

Flexible Learning Options
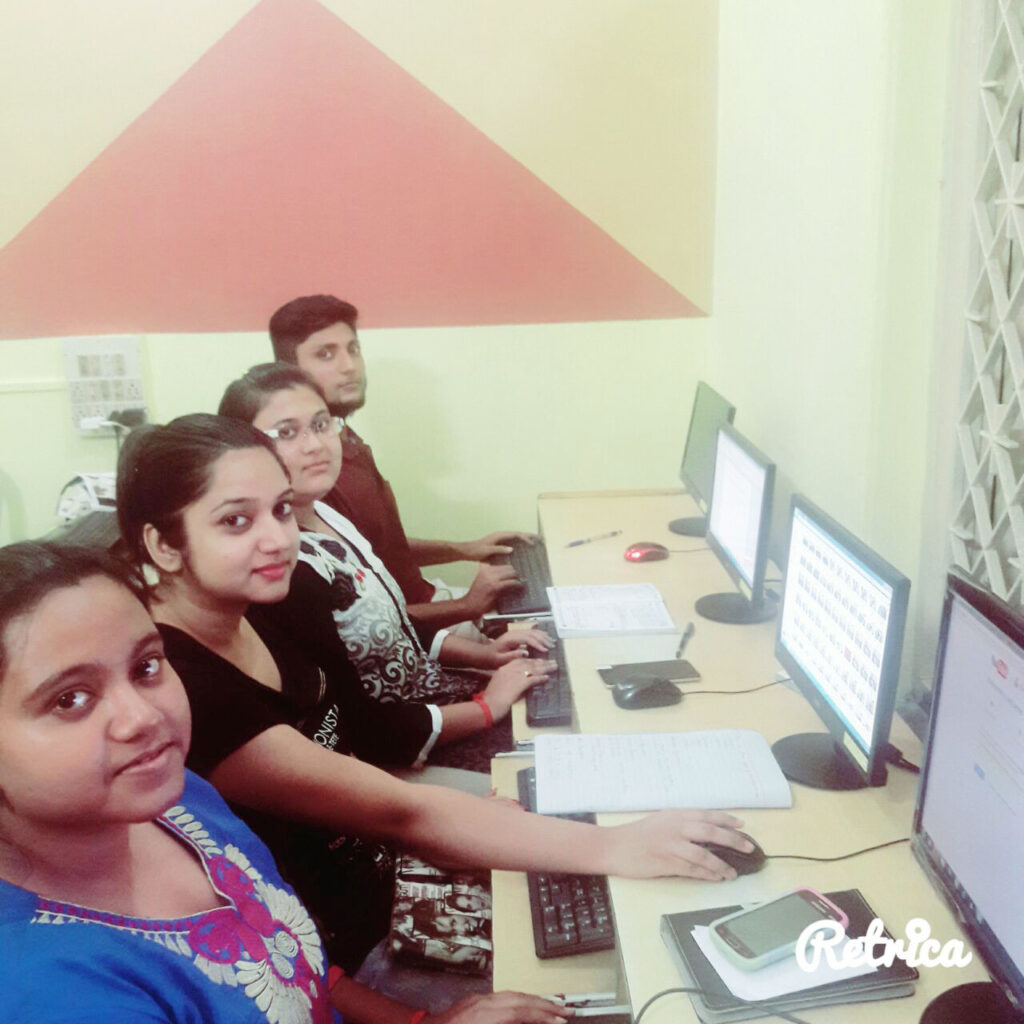
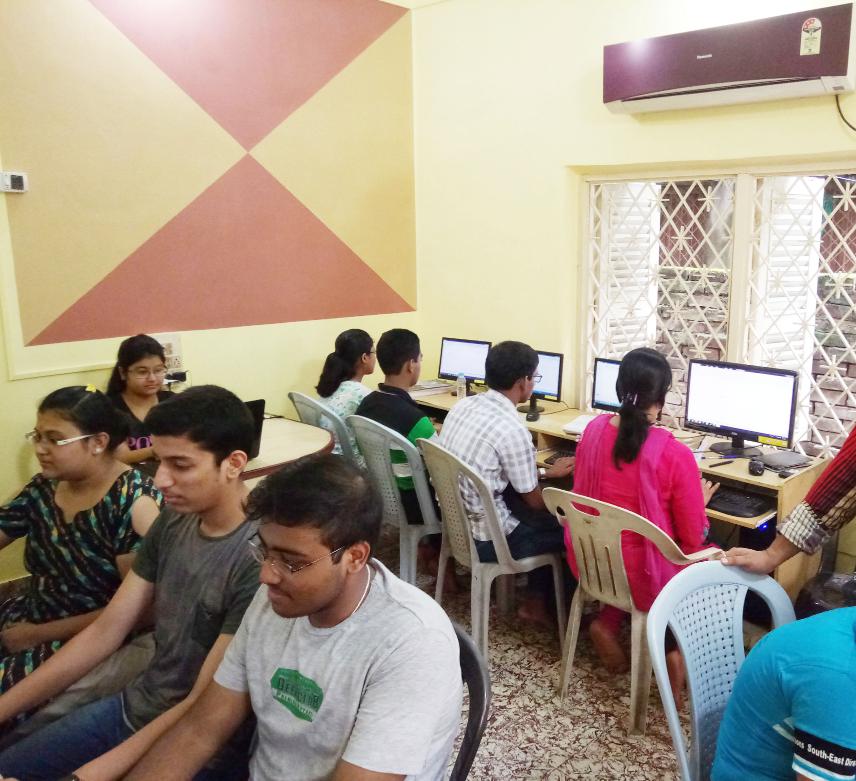
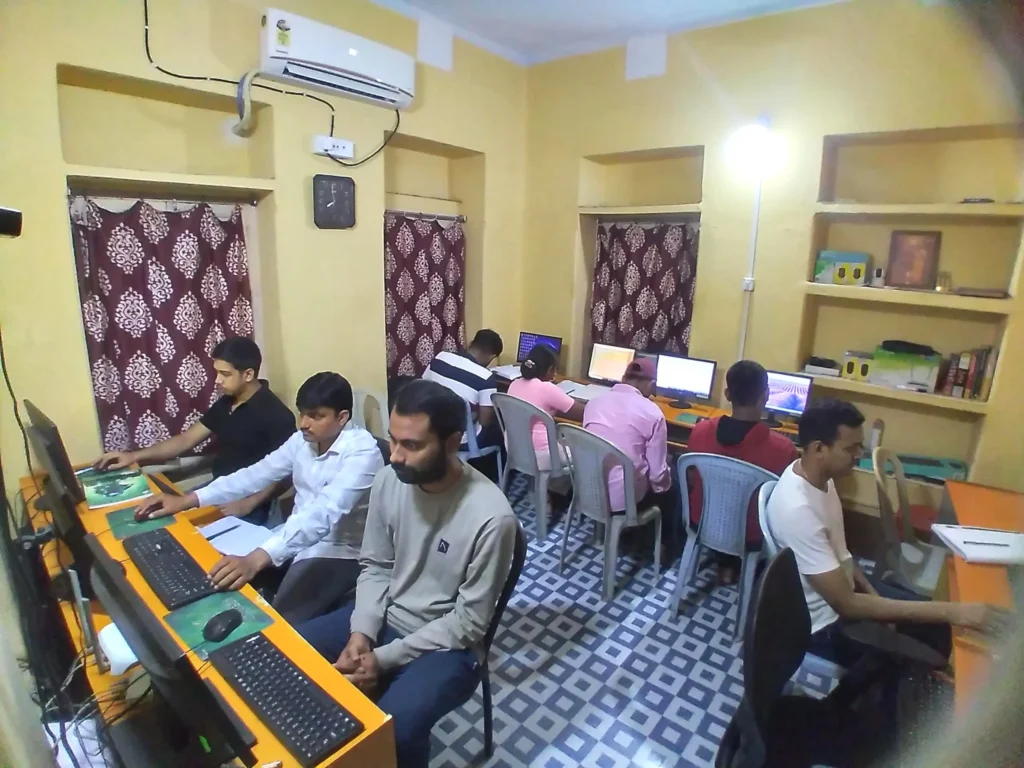
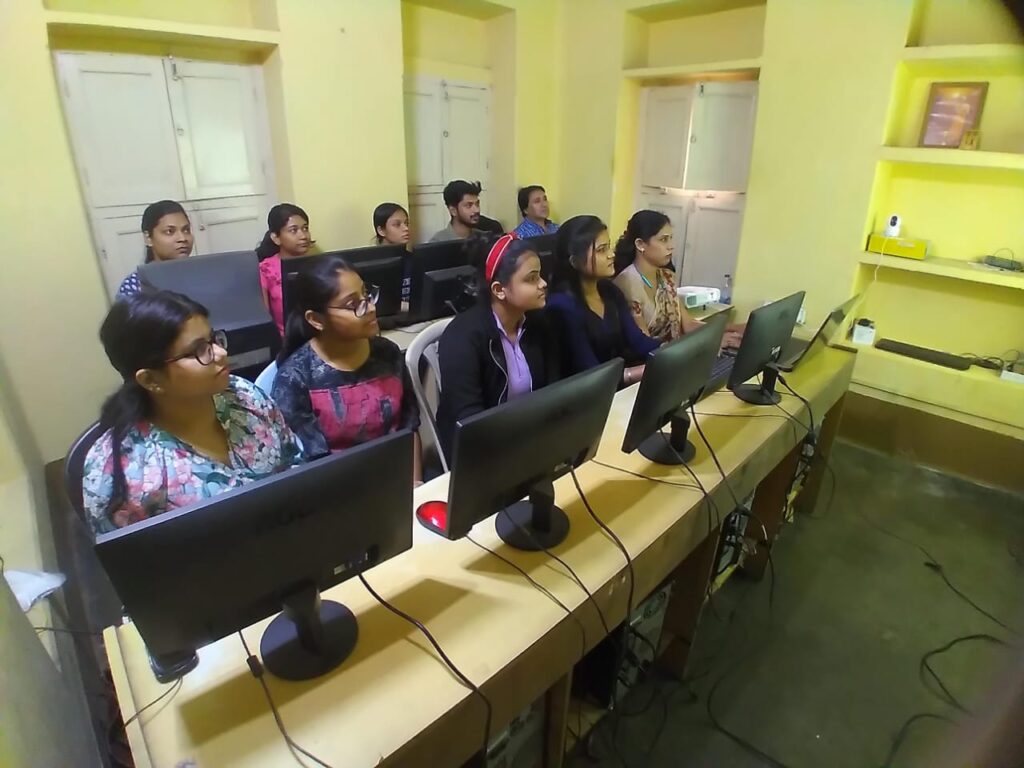
Whether you prefer classroom-based Data Analytics classes in Kolkata or instructor-led online sessions, the objective remains the same — providing a structured learning environment where learners can practise regularly and receive guidance throughout the learning process.
Career Guidance and Interview Preparation
Learning a Data Analytics Course is only one part of becoming job-ready. C-Cube also supports employability skill development through resume guidance, communication and soft-skill development, portfolio guidance, mock interviews and career preparation.
Practical, Project-Based Learning
Students work with datasets, business questions, reports, queries and dashboards instead of learning tools only through theory.
The programme includes 4 guided practical projects to apply learning and build demonstrable work.
Our Training Approach
To learn more about our teaching approach , learning environment and why students choose us, visit our Data Analytics Training Institute in Kolkata page.
Data Analytics Course Fees, Duration and Training Mode
Course Fees
₹35,000/-
(7 Installments of ₹5,000/- each)
Course Duration
8 Months + Project – 1 Month
Classes
3 Days a Week
Offline | Online | Hybrid
Ready To Start Your
Data Analytics Journey
Contact C-Cube Centre of Computer Education, Kolkata.
Centre Address : 33/3C, Chetla Central Road , Kolkata – 700027.
Contact Number: 9007116752
What Students Say About Us—Student Reviews
Rabikanta Jana
I completed the Data Analytics course from C-Cube Kolkata, and my overall experience was excellent. The course covers Python, SQL, Advanced Excel, Power BI in a very clear and practical manner, starting from basics to advanced level. The teachers are highly experienced, professional, and very supportive. Every topic is explained with real-life examples, hands-on practice, and project work, which helped me understand data analysis concepts clearly. For anyone who wants to build a career as a Data Analyst, I would suggest C-Cube for Data Analytics Training in Kolkata.

Prantosh Nath
I recently completed my offline Data Analysis course from C-Cube Centre of Computer Education Kolkata and had a great learning experience. During the course, I learnt Python, Advanced Excel, SQL, Power BI, through 100% practical, industry-oriented training, which helped me gain real-world skills. C-Cube provided excellent guidance and support throughout the course. I would definitely recommend this institute to anyone who want to start his career as Data Analyst.

Debosmita Kar
I joined C-Cube for the Data Analytics training program covering Excel, SQL, Python, and Power BI, and the experience has honestly been fantastic. The trainers are excellent as they break down complex concepts into really simple steps, plus they take time for one-on-one doubt-clearing sessions whenever you get stuck. Their placement team is quite active too—they helped me prepare my resume, ran mock interviews, improved my Soft Skill Communication. Highly recommend it if you are looking to break into the tech side from scratch.
Data Analytics FAQs
Yes. The course is suitable for beginners, graduates, working professionals and learners starting their journey in Data Analytics.
No. A technical or programming background is not required. The training starts with the fundamentals and gradually introduces the required tools and Python.
The training covers Advanced Excel, SQL, Power BI, Python and Statistics.
The program duration is 9 months in total—8 months of training followed by 1 month of project work.
The total course fee is ₹35,000, payable in 7 installments of ₹5,000 each.
The programme includes 4 guided practical projects based on real-world data analysis and reporting scenarios.
Yes. You can attend in the classroom, join instructor-led online sessions, or combine both in a hybrid format
Depending on your skills, qualifications and experience, you can explore roles such as MIS Executive, Reporting Analyst, Junior Data Analyst, Business Analyst and Junior BI/Dashboard roles.
Yes. Support includes resume guidance, mock interviews and help explaining your projects. The full list is in the Career Guidance section above. We can’t promise placement, because results depend on your skills, projects and the job market.
Eligible learners will be offered certification options from Medhavi Foundation and NBCE, subject to the applicable course, assessment, and certification requirements.
Related Data Analytics Resources
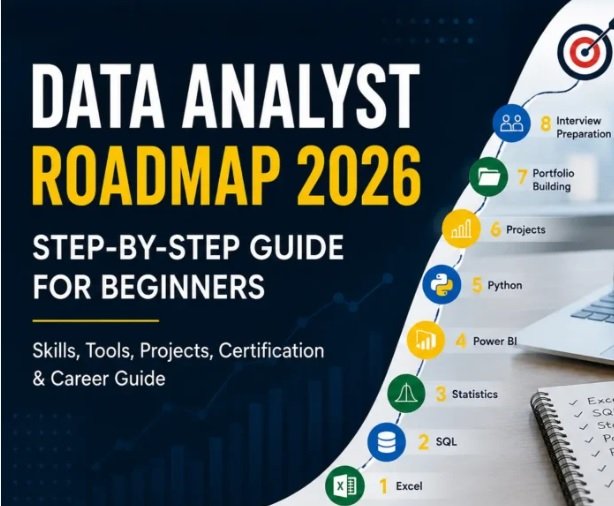
1. Data Analyst Roadmap 2026: Step-by-Step Guide for Beginners
Helps beginners understand the learning sequence, essential tools, projects and career preparation before enrolling.
Read the Data Analyst Roadmap
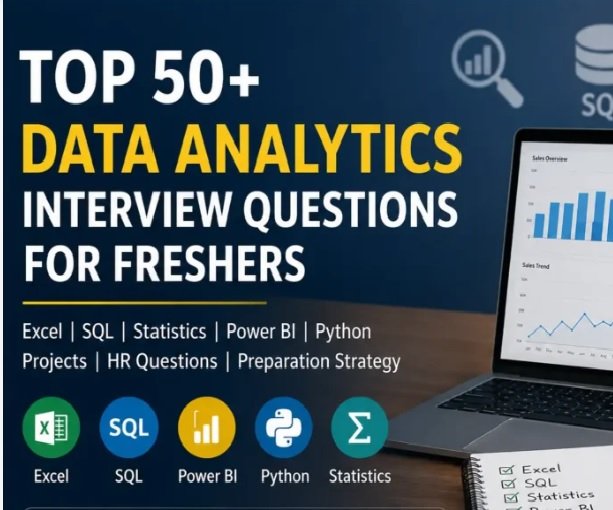
2. Top Data Analytics Interview Questions For Freshers in Kolkata
Prepare for entry-level interviews with commonly asked Data Analytics questions and strengthen your understanding of key concepts.
Explore the interview Preparation Guide
3. Why Students in Kolkata Are Choosing Data Analytics as a Career in 2026?
Discover why Data Analytics is attracting aspiring professionals and what to consider when exploring this career path.
Discover the Career Trend
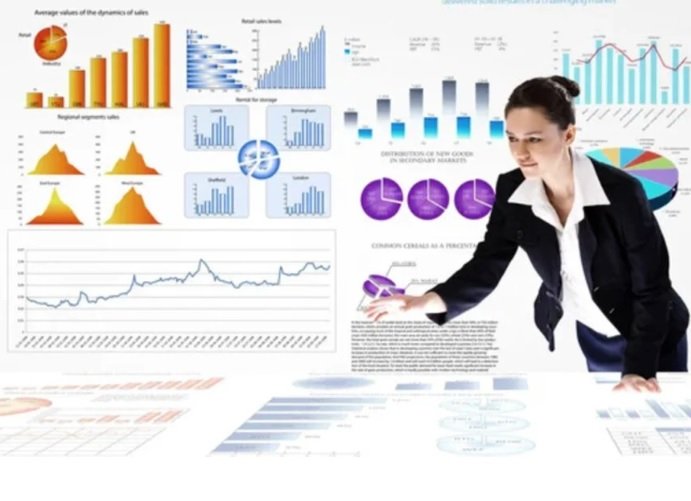
4. How Practical Data Analytics Training Helps Build Career Opportunities in Kolkata?
Learn how hands-on exercises, practical projects and tool-based learning can help you develop skills relevant to entry-level analytics roles.
Understand the Value of Practical Training
Explore Related Courses
1. Advanced Excel Training
Relevant for learners who need stronger spreadsheet, reporting, formula and dashboard skills.
Explore Our Advanced Excel Course
2. Power BI Training in Kolkata
Best complementary course for learners who want to focus more deeply on interactive dashboards, reporting and business intelligence.
Discover Our Power BI Training
3. Python for Data Analytics
Suitable for learners who want to strengthen Python, data handling, analysis and visualisation skills beyond the core analytics workflow.
Explore Python for Data Analytics
4. Data Science with Python
A logical next step for learners who want to move from reporting and analysis towards statistics, predictive modelling and machine learning.
Know About Our Data Science Course
Ready To Start Your Career
In Data Analytics?
Call Us Today To Know More About The Course