How to Learn Advanced Excel in Kolkata – A Complete Roadmap for Beginners & Working Professionals
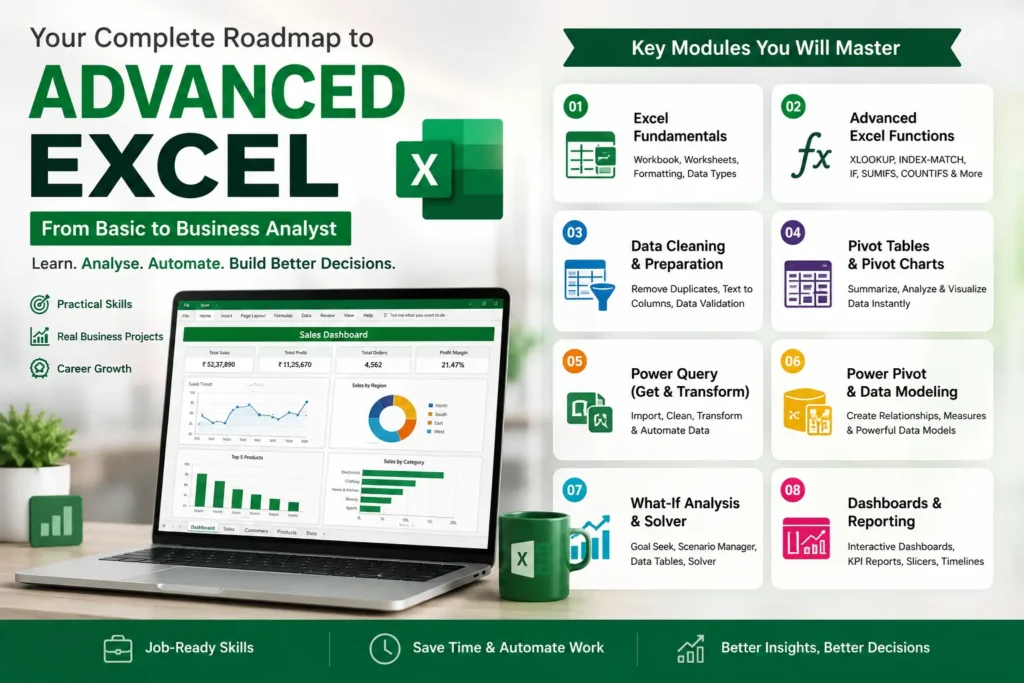
As the Centre Director of C-Cube and a senior computer training mentor with more than 25 years of experience in computer education, I have worked with many students, graduates, job seekers, and working professionals who wanted to build stronger career opportunities through Advanced Excel Skills. During this journey, I have realised that success in Excel is not about memorising formulas—it comes from learning the right concepts in the right sequence and applying them to solve real business problems.
Many learners begin by watching random YouTube videos or practising isolated functions without following a structured learning roadmap. While they may remember individual formulas, they often struggle to analyse business data, automate reports, or build dashboards confidently. This complete roadmap explains how to learn Microsoft Excel for professional reporting and data analysis step by step so that every new concept builds naturally on the previous one.
The truth is that learning professional spreadsheet skills is not about remembering hundreds of formulas. It is about understanding how businesses organise data, analyse information, automate repetitive work, and prepare professional reports for better decision-making.
Whether your goal is to become an MIS Executive, Data Analyst, Financial Analyst, Reporting Executive, or Business Analyst, developing strong Business Excel Skills can provide a solid foundation for your career.
In this guide, I will explain a practical roadmap that I personally recommend to students before joining an Advanced Excel Training in Kolkata. You will learn the correct sequence of topics, the tools that employers actually expect, the projects you should build, the career opportunities available, and the common mistakes that beginners should avoid.
If you follow this roadmap patiently and practise consistently, learning Microsoft Excel becomes much easier and far more rewarding than trying to learn isolated formulas without understanding where they are actually used.
Why Learning Professional Excel Skills Is Still One of the Smartest Career Decisions?
One question that students frequently ask , “Is Microsoft Excel still useful when tools like Power BI, Python, and Artificial Intelligence are becoming so popular?”
The answer is Yes. In fact, organisations across industries continue to rely on Microsoft Excel for reporting, analysis, planning, budgeting, forecasting, inventory management, payroll processing, and business decision-making. While modern analytical tools are becoming increasingly popular, Excel still acts as the starting point for analysing business data.
Most companies collect data from multiple sources before transforming it into useful reports. During this process, professionals use Excel Reporting Skills to clean datasets, remove duplicate records, perform calculations, summarise information using Pivot Tables, create dashboards, and prepare reports for management.
Another important reason behind Excel’s popularity is its accessibility. Almost every office computer already has Microsoft Excel installed. Employees from different departments—including HR, Finance, Sales, Operations, Marketing, Logistics, and Administration—use Excel every day because it allows them to organise and interpret data quickly without requiring programming knowledge.
For students who are planning a career in analytics, Excel skills also serves as an excellent stepping stone before learning SQL, Power BI, Python, or Machine Learning. Once you understand how to work with structured business data inside Excel, learning other analytical tools becomes much easier.
That is why many learners first choose an Advanced Excel Course in Kolkata before progressing towards Data Analytics or Business Intelligence.
Instead of thinking of Excel as an old software, think of it as one of the most practical business tools that continues to evolve with features like Power Query, Dynamic Arrays, Power Pivot, and automation capabilities.
Who Should Learn Advanced Microsoft Excel?
One of the biggest misconceptions about Excel is that it is useful only for accountants. In reality, Business Excel Skills are valuable across almost every industry because data has become an essential part of modern business operations.
If you are a college student preparing for your first job, learning Excel early can give you an advantage during placements. Many companies expect fresh graduates to know how to organise data, prepare reports, use formulas, and analyse information before they even join the organisation.
Job seekers who are applying for roles in MIS, Operations, Customer Support, Administration, or Business Reporting can significantly improve their employability by completing an Advanced Excel Training in Kolkata and building practical reporting skills.
Working professionals can also benefit by learning advanced reporting techniques, dashboard creation, automation, and Power Query. These skills help save time, improve productivity, and often create opportunities for promotions because employees become capable of handling larger datasets with greater efficiency.
Business Excel Skills is particularly suitable for:
- Students preparing for campus placements
- Graduates looking for office-based jobs
- MIS Executives
- Data Analysts
- Financial Analysts
- Accountants
- HR Executives
- Sales & Marketing Professionals
- Operations Executives
- Business Analysts
- Entrepreneurs managing business data
Advanced Excel Learning Roadmap – The Right Path to Build Professional Excel Skills
One of the biggest reasons why many learners struggle with Excel is that they try to learn everything at once. They jump directly into complex formulas, Power Query, or VBA without first building a strong foundation. As a result, they often become confused and lose confidence.
During our training sessions, we always recommend following a structured Professional Microsoft Excel Learning Roadmap where each topic builds upon the previous one. This approach not only makes learning easier but also helps students understand how different Excel tools work together in real business situations.
An expert Excel user does much more than apply formulas. They clean data, organise information, analyse reports, automate repetitive work, and present meaningful business insights through dashboards. Each of these skills requires learning in the correct sequence.
The roadmap below follows the same practical approach that many professionals use in industries such as finance, operations, MIS reporting, human resources, business analysis, and Practical Data Analytics.
Following this roadmap helps learners gradually move from understanding basic spreadsheet operations to mastering Spreadsheet Skills required in today’s workplace.
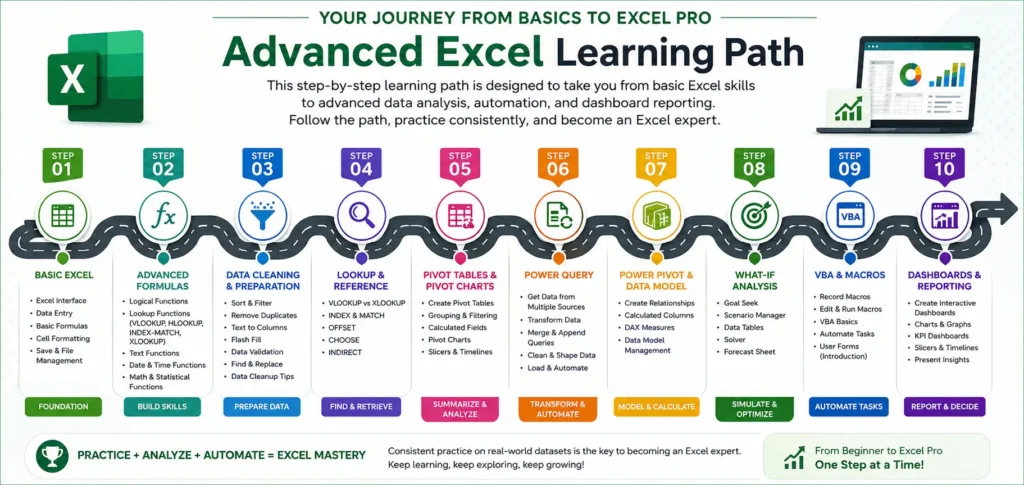
Learning Roadmap
🟢 Stage 1 – Build Strong Excel Foundations
🔵 Stage 2 – Learn Professional Ms-Excel Functions
🟣 Stage 3 – Clean & Organise Business Data
🟠 Stage 4 – Analyse Data with Lookup Functions
🟡 Stage 5 – Master Pivot Tables
🟢 Stage 6 – Transform Data using Power Query
🔷 Stage 7 – Build Data Models with Power Pivot
🟣 Stage 8 – Perform Business Analysis
🔴 Stage 9 – Automate Repetitive Tasks
⭐ Stage 10 – Build Interactive Dashboards & Reports
Stage 1 – Build Strong Excel Foundations
Every successful Excel professional begins with a strong foundation. Although this is called an Advanced Microsoft Excel roadmap, the first step is understanding how Excel stores, organises, and manages data.
Many learners underestimate the importance of this stage and immediately start practising advanced formulas. However, if the underlying spreadsheet is not organised correctly, even the most advanced functions produce inaccurate results.
At this stage, learners focus on:
- Creating structured tables
- Cell referencing
- Formatting data professionally
- Sorting and filtering records
- Data Validation
- Named Ranges
- Removing duplicate entries
- Basic calculations
- Understanding workbook structure
These concepts may appear simple, but they become the building blocks for every Microsoft Excel feature that follows.
For example, before creating Pivot Tables or Power Query workflows, you must first know how to organise datasets correctly. Clean and structured data leads to accurate analysis, while poorly organised spreadsheets often result in reporting errors.
Building this strong foundation makes every later stage of the Professional Excel Course much easier to understand.
Stage 2 – Learn Advanced Professional Excel Functions
Once your data is organised properly, the next step is learning how Excel performs calculations and logical analysis.
This is the stage where many students realise that Excel is much more than addition and subtraction. Modern business reporting depends heavily on combining multiple functions to answer practical business questions.
Rather than memorising formulas individually, learners should understand where each function is used and how different functions work together.
Some of the most important functions include:
- XLOOKUP
- INDEX & MATCH
- IF
- IFS
- SUMIFS
- COUNTIFS
- TEXT Functions
- DATE Functions
- Error Handling Functions
- Dynamic Arrays
For example, HR departments use IF statements for attendance analysis, finance teams rely on SUMIFS for budgeting, and sales teams frequently use lookup functions to retrieve customer or product information from large datasets.
Learning these Practical Excel Functions develops analytical thinking and prepares learners for more advanced reporting tasks later in the roadmap.
Instead of remembering hundreds of formulas, focus on understanding the logic behind them. Once the logic becomes clear, writing formulas becomes much easier.
Stage 3 – Clean and Prepare Business Data
One of the most important responsibilities of an Excel professional is preparing messy business data before analysis.
In reality, business datasets rarely arrive in a clean format. Customer names may be inconsistent, duplicate records may exist, blank cells may appear frequently, and data collected from different departments often follows different formats.
Before creating reports or dashboards, professionals spend considerable time cleaning and transforming data.
During this stage, learners understand how to:
- Remove duplicate records
- Split text using Text to Columns
- Merge information from different sheets
- Standardise inconsistent formats
- Handle blank values
- Use Flash Fill
- Apply Data Validation
- Prepare structured datasets
These skills save significant time and improve reporting accuracy.
Data preparation is one of the most valuable Data Analysis Skills because every analytical process begins with reliable data.
Many employers value professionals who can prepare business data efficiently before performing analysis.
Stage 4 – Analyse Business Data Using Pivot Tables
Once the data has been cleaned properly, it is ready for analysis.
This is where Pivot Tables become one of the most powerful tools available in Microsoft Excel.
Rather than writing multiple formulas manually, Pivot Tables allow users to summarise thousands of records within seconds.
Business professionals use Pivot Tables to answer questions such as:
- Which product generated the highest sales?
- Which region performed best?
- Which employee achieved maximum targets?
- What was the monthly revenue trend?
- Which department incurred the highest expenses?
Learners also understand:
- Pivot Charts
- Slicers
- Timelines
- Grouping
- Drill Down
- Interactive Reporting
Stage 5 – Transform Business Data Using Power Query
Once you become comfortable working with formulas and Pivot Tables, the next logical step is learning Power Query in Excel. This is one of the most valuable skills for anyone who regularly works with large datasets.
Imagine receiving monthly sales reports from different branches, customer records from multiple Excel files, or CSV files downloaded from software systems. Manually copying, cleaning, and combining this data every month can take hours. Power Query automates this entire process.
Instead of repeating the same steps every time new data arrives, Power Query allows you to create a reusable workflow. Once the query is built, refreshing the report updates the entire dataset automatically.
During this stage, learners understand how to:
- Import data from multiple Excel files
- Import CSV files
- Combine datasets
- Append tables
- Merge queries
- Remove duplicate records
- Replace blank values
- Split and merge columns
- Change data types
- Create reusable data transformation workflows
Learning Power Query not only saves time but also reduces manual errors and improves reporting accuracy.
Today, organisations handling large volumes of business data actively look for professionals who understand Power Query in Excel because it significantly improves productivity. Whether you work in finance, operations, HR, or reporting, Power Query helps automate repetitive data preparation tasks and allows you to focus more on analysis instead of manual work.
For anyone planning to pursue Data Analytics, mastering Power Query is an excellent foundation before moving to SQL or Power BI.
Stage 6 – Build Powerful Data Models Using Power Pivot
After learning how to prepare clean datasets using Power Query, the next stage is understanding how to analyse larger datasets using Power Pivot.
Traditional Excel worksheets work well for moderate amounts of data, but modern businesses often generate thousands or even millions of records. Power Pivot helps Excel manage these larger datasets efficiently while creating relationships between different tables.
Rather than storing everything inside one spreadsheet, Power Pivot allows multiple related tables to work together much like a database.
At this stage, learners understand how to:
- Create relationships between tables
- Build Data Models
- Analyse multiple datasets together
- Generate meaningful reports
- Understand calculated columns
- Create measures
- Perform advanced business analysis
Power Pivot becomes extremely useful for analysing information such as:
- Customer orders
- Sales transactions
- Product inventories
- Employee performance
- Financial records
Instead of manually combining worksheets, learners discover how Excel can manage interconnected business data more efficiently.
Although Power Pivot appears advanced initially, understanding its practical business applications helps students appreciate why modern reporting increasingly depends on structured data models.
If your career goal includes becoming a Data Analyst, MIS Executive, or Reporting Analyst, learning Power Pivot strengthens your overall Advanced Professional Excel Skills and prepares you for more advanced analytical tools in the future.
Stage 7 – Improve Business Decision-Making Using What-If Analysis and Solver
Excel is not only used to prepare reports. One of its greatest strengths lies in helping businesses make better decisions before taking action.
Features such as Goal Seek, What-If Analysis, Scenario Manager, Data Tables, and Solver allow professionals to test different business situations without changing actual business operations.
For example, A finance manager may want to know: What sales target is required to achieve ₹10 lakh profit?
A business owner may ask: Which combination of products gives the maximum profit?
A loan officer may calculate: What EMI changes if interest rates increase?
Instead of manually trying different values repeatedly, Excel automatically calculates possible outcomes.
During this stage, learners understand how to use:
- Goal Seek
- What-If Analysis
- Scenario Manager
- Data Tables
- Solver
These tools are widely used in:
- Budget planning
- Financial forecasting
- Pricing decisions
- Business strategy
- Sales target planning
- Investment analysis
Learning these analytical features develops problem-solving skills rather than simply improving spreadsheet knowledge. Employers appreciate professionals who can use Excel to evaluate different business scenarios and support informed decision-making.
Stage 8 – Create Interactive Dashboards and Professional Business Reports
The final stage of the learning journey focuses on presenting information in a way that decision-makers can understand quickly.
Collecting and analysing data is only useful if the results can be communicated effectively. This is why dashboard development has become one of the most valuable Spreadsheet Skills in today’s workplace.
A well-designed Excel Dashboard allows managers to monitor business performance at a glance. Instead of reading lengthy reports, they can instantly identify trends, compare performance, and make informed decisions.
During this stage, learners understand how to:
- Design interactive dashboards
- Create KPI reports
- Build dynamic charts
- Use Pivot Charts
- Add slicers and timelines
- Apply Conditional Formatting
- Organise business reports professionally
- Present insights visually
Students also learn important dashboard design principles such as:
- Keeping reports simple
- Highlighting key performance indicators
- Using colours meaningfully
- Avoiding unnecessary visual clutter
- Making reports easy to update
Throughout our Professional Microsoft Excel Training in Kolkata, we encourage learners to build dashboards using real business datasets instead of sample examples. This practical approach improves confidence while preparing students for actual reporting responsibilities in the workplace.
Whether you plan to work as an MIS Executive, Data Analyst, Reporting Analyst, Financial Analyst, or Operations Executive, creating professional dashboards becomes one of the most valuable skills you can showcase during interviews.
By the time you complete this stage, you are no longer simply using Excel—you are solving business problems through structured reporting, data analysis, and professional visualisation.
Hands-On Business Projects That Help You Build Real Excel Skills
One of the biggest differences between simply learning Excel and becoming confident with Excel is working on practical business projects.
Many students complete an Excel course by practising isolated formulas, but when they are asked to prepare an actual MIS report or analyse a sales dataset during an interview, they struggle because they have never applied those concepts in a real business situation.
That is why I always encourage learners to build projects alongside their learning journey. Practical projects help you understand how multiple Excel features work together instead of treating them as separate topics.
Some excellent practice projects include:
Sales Performance Dashboard
Create an interactive sales dashboard showing monthly sales, region-wise performance, product profitability, and KPI summaries using Pivot Tables, Charts, Slicers, and Conditional Formatting.
Skills Developed
Dashboard Design • Pivot Tables • Charts • KPI Reporting
Employee Attendance & Payroll Report
Build an attendance tracker that automatically calculates working days, overtime, leave balances, and salary summaries using formulas, logical functions, and Data Validation.
Skills Developed
Logical Functions • Data Validation • Reporting
Inventory Management Dashboard
Monitor stock availability, reorder levels, supplier information, and product movement through interactive Excel reports.
Skills Developed
Lookup Functions • Conditional Formatting • Business Reporting
Customer Sales Analysis
Analyse customer purchasing behaviour, identify top-performing products, and generate regional sales reports using Pivot Tables, Power Query, and interactive charts.
Skills Developed
Power Query • Pivot Tables • Data Analysis
Career Opportunities After Learning Business Excel Skills
One of the most common questions students ask before joining an Excel Training in Kolkata is: “Will learning Business Excel Skills help me get a better job?”
The answer depends on how effectively you apply your Excel skills.
Spreadsheet Skills is rarely a job by itself. Instead, it becomes a powerful skill that supports multiple careers across different industries. Almost every organisation works with business data, and professionals who can analyse, organise, and present that data are always in demand.
Some of the career opportunities where Practical Excel Skills are highly valued include:
Data Analyst
Clean datasets, analyse trends, prepare reports, and support business decision-making using Excel, Power Query, and data visualisation techniques. Students who want to explore Data Analyst Career Roadmap For Beginners can read our blog for detailed knowledge.
Financial Analyst
Work with budgeting, forecasting, profitability analysis, investment calculations, and financial reporting using Microsoft Excel functions and analytical tools.
Reporting Analyst
Create structured business reports, KPI dashboards, and performance summaries for management teams across different departments.
Business Operations Executive
Track operational performance, analyse workflow efficiency, maintain business trackers, and automate repetitive reporting tasks.
Junior Business Analyst
Interpret business data, compare scenarios, identify trends, and communicate meaningful insights through dashboards and analytical reports.
Frequently Asked Questions (FAQs)
1) Who should join an Advanced Excel Training in Kolkata?
This course is suitable for students, graduates, working professionals, MIS executives, finance professionals, and anyone who wants to improve data analysis, reporting, and business productivity using Excel Reporting Skills.
2) Is Professional Excel Skills enough to become a Data Analyst?
Advanced Excel is an excellent starting point, but combining it with SQL, Power BI, and Python significantly improves your chances of building a successful Data Analytics career.
3) Do I need Basic Excel knowledge before learning Excel Skills?
Yes. A basic understanding of formulas, worksheets, formatting, and data entry makes learning Spreadsheet Analysis Skills much easier. Most training programs begin with a quick revision of Excel fundamentals.
4) What are the most important topics covered in Advanced Ms-Excel?
Key topics include Pivot Tables, Power Query, Power Pivot, XLOOKUP, INDEX-MATCH, Dashboards, Conditional Formatting, Goal Seek, Solver, Dynamic Arrays, and Data Analysis.
5) How long does it take to learn Advanced Microsoft Excel Skills?
With regular practice, most learners can develop practical Microsoft Excel Skills within 3 months, depending on their learning pace and project experience.
6) Is Power Query more useful than VBA?
For most reporting and data analysis jobs today, Power Query is more widely used than VBA because it automates data cleaning and transformation without requiring programming knowledge.
7) What career opportunities are available after learning Spreadsheet Excel?
Advanced Excel can support careers such as MIS Executive, Data Analyst, Reporting Analyst, Financial Analyst, Business Operations Executive, and Junior Business Analyst.
8) Will I receive a certificate after completing the course?
Yes. Students who successfully complete the training and assessment are eligible to receive a Central Govt. Approved Certification from NBCE & Medhavi Skill Foundation.
9) Why are Pivot Tables important in Practical Excel Skills?
Pivot Tables help summarise, analyse, and present large datasets quickly, making them one of the most frequently used Excel features in reporting, MIS, and business analysis roles.
10) Which is better for career growth—Advanced Excel or Power BI?
They complement each other. Advanced Excel builds strong data analysis fundamentals, while Power BI helps create interactive business dashboards. Learning both provides better career opportunities.
Final Thoughts
Learning Advanced Professional Excel is not about becoming a formula expert. It is about developing the confidence to organise business data, automate repetitive tasks, analyse information, and prepare professional reports that support better decision-making.
By following a structured learning roadmap—from Excel fundamentals and advanced functions to Power Query, Power Pivot, dashboards, and real business projects—you gradually build the practical skills that employers genuinely value.
Whether you are a student preparing for placements, a working professional looking to improve productivity, or someone planning a career in analytics, investing time in developing Business Excel Skills can create long-term career opportunities.
If you would like to learn through guided practice, real-world projects, and structured mentoring, you can explore our Advanced Excel Training in Kolkata, where the complete learning journey is designed to help students build confidence step by step.
Learners interested in analytics can also explore our Data Analytics Course in Kolkata, where Advanced Microsoft Excel is taught alongside SQL, Python, Power BI, Tableau, and Machine Learning to prepare for modern data-driven careers.
About the Author
Sudipta Chakraborty

Sudipta Chakraborty is the Centre Director and senior faculty mentor at C-Cube Centre of Computer Education, Kolkata, with more than 25 years of experience in computer education, student mentoring, and career-oriented skill development. He regularly writes about Data Analytics, emerging technologies, career trends, and practical learning approaches to help students and professionals make informed career decisions.
Readers interested in understanding more about the author’s professional background and experience in computer education can also connect through LinkedIn
For Free Counseling Call – 9007116752
Our Recent Posts
- C-Cube Partners with Medhavi Foundation: A New Step Towards Skill-Based Certification

- How to Learn Advanced Excel in Kolkata: A Complete Roadmap for Beginners and Working Professionals
- Top Data Analytics Interview Questions for Freshers in 2026 (With Practical Answers)
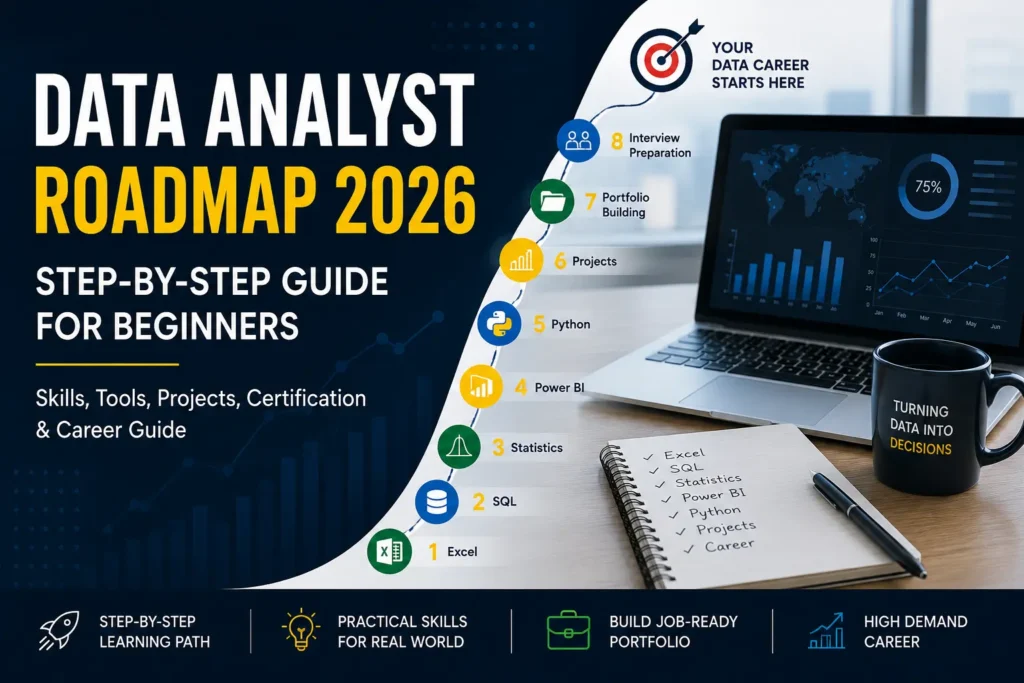
- Data Analyst Roadmap 2026 – Step-by-Step Learning Guide for Beginners
- How Beginners Can Start Learning Data Analytics in Kolkata
- Why Students in Kolkata Are Choosing Data Analytics as a Career in 2026 ?